
- A profitable whale has made another huge bet on PEPE after buying 173B tokens.
- PEPE was relatively discounted and hit a key demand level.
Pepe’s [PEPE] recent pullback hit a key August demand level, stroking interest from key players, including whales. According to the blockchain analytic platform Spot On Chain, a familiar whale has scooped 173 billion PEPE, worth about $1.3 million.
Last year, the whale made a huge bet on PEPE and held the frog-themed meme coin for nine months, gaining over 800%.
‘In the first trade, the whale spent only 200K $USDC to buy 170.2B $PEPE in Oct 2023 and then sold all for 1.97M $USDC in Jul 2024, taking a $1.77M (+886%) profit after holding for 9 months!’
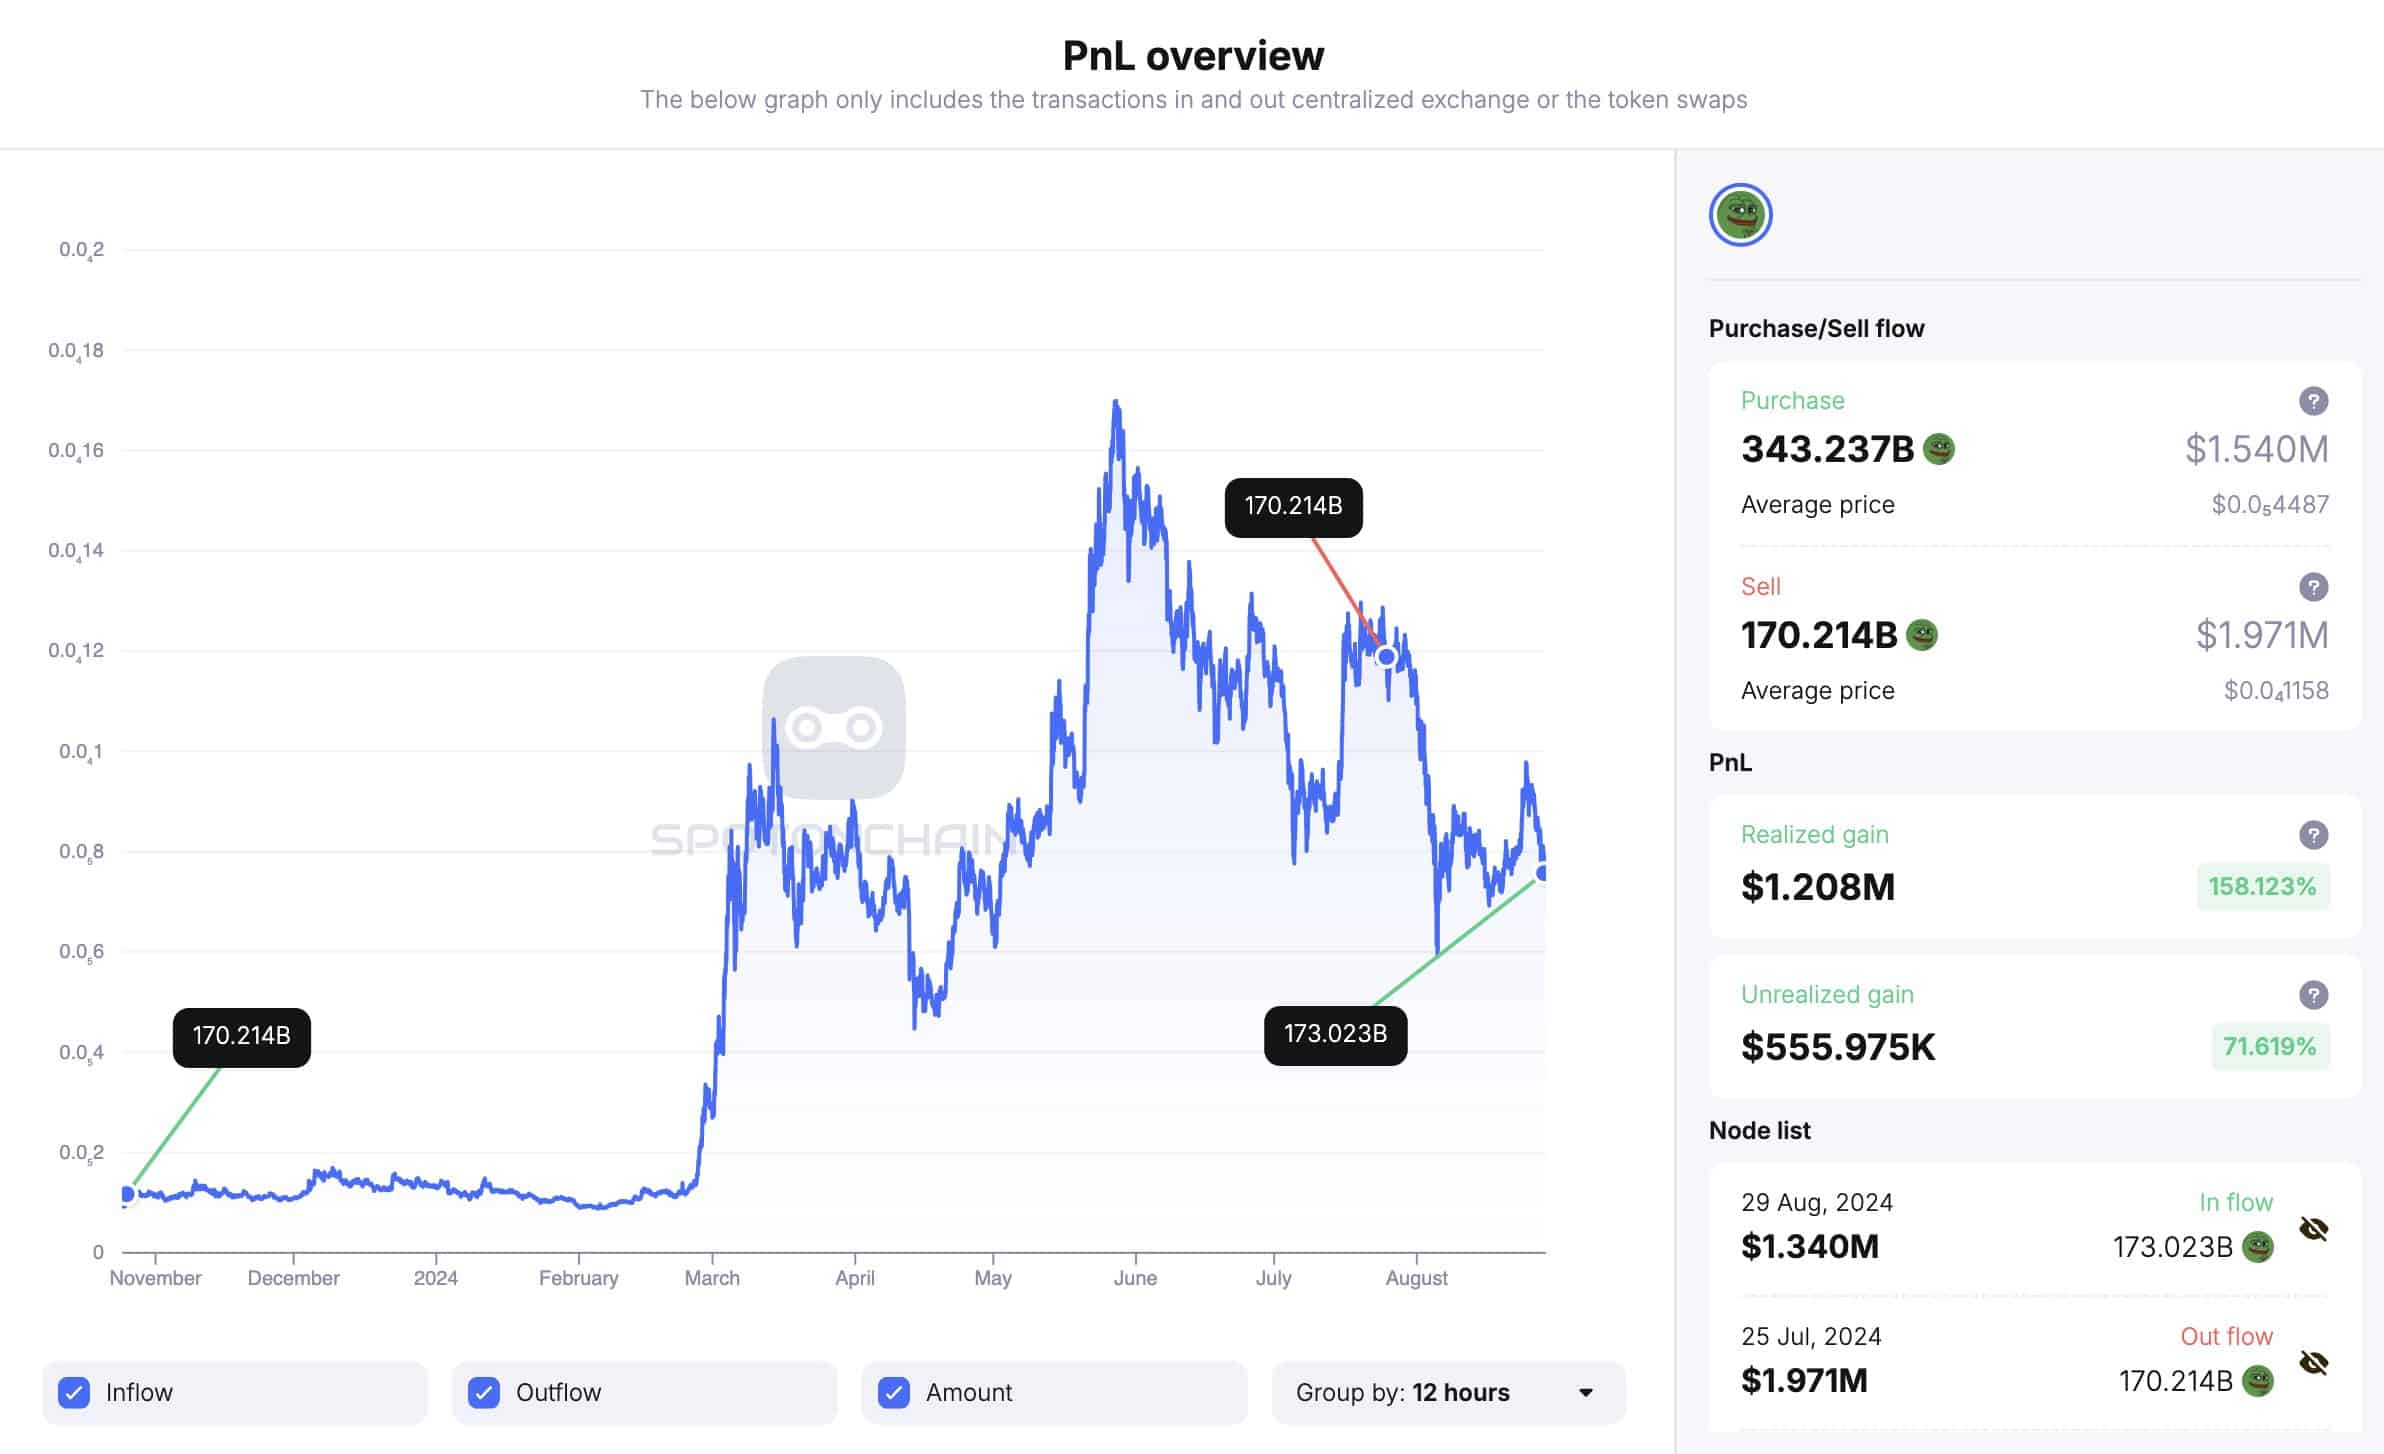
Source: SpotOnChain
Will the huge bet pay off?
Whether the whale’s bet will pay again remains to be seen. However, the whale’s market re-entry on the price charts was, interestingly, at a crucial demand level.
Besides, the memecoin’s current price (near $0.000007) appeared to be undervalued.
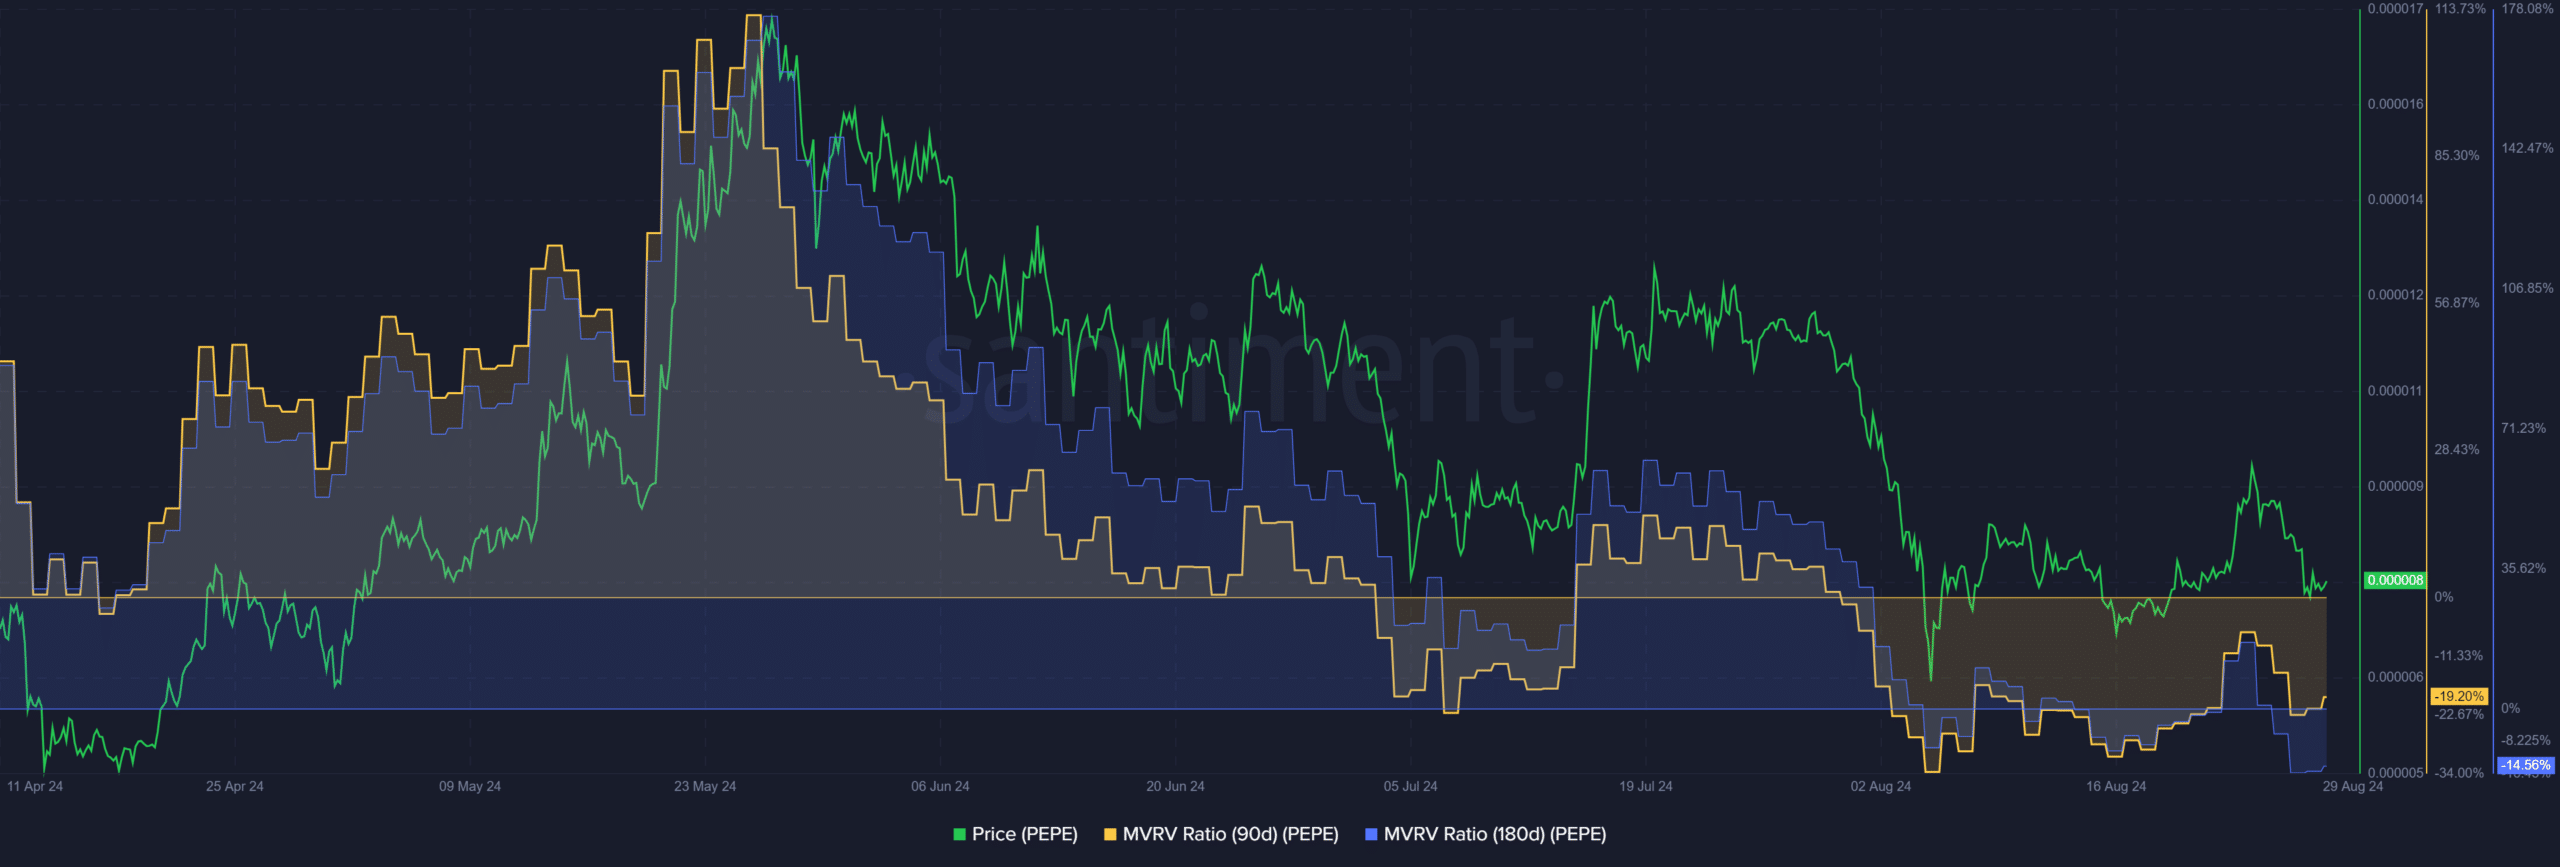
Source: Santiment
According to Santiment, the portfolios of 90-day and 180-day holders were in red. This was indicated by the 90-day and 180-day MVRV (Market Value to Realized Value) ratios, respectively.
MVRV tracks whether tokens are overvalued or undervalued, with negative figures indicating underpriced assets. Given near and medium-term token holders recorded 19% and 14% losses, respectively, the token was deemed underpriced.
Additionally, the overall weighted sentiment for the memecoin was at its lowest. This was a risk-off scenario typically capitalized by investors eyeing long-term positions off the market fears or bloodbath. In short, the current PEPE’s value was a relative bargain.
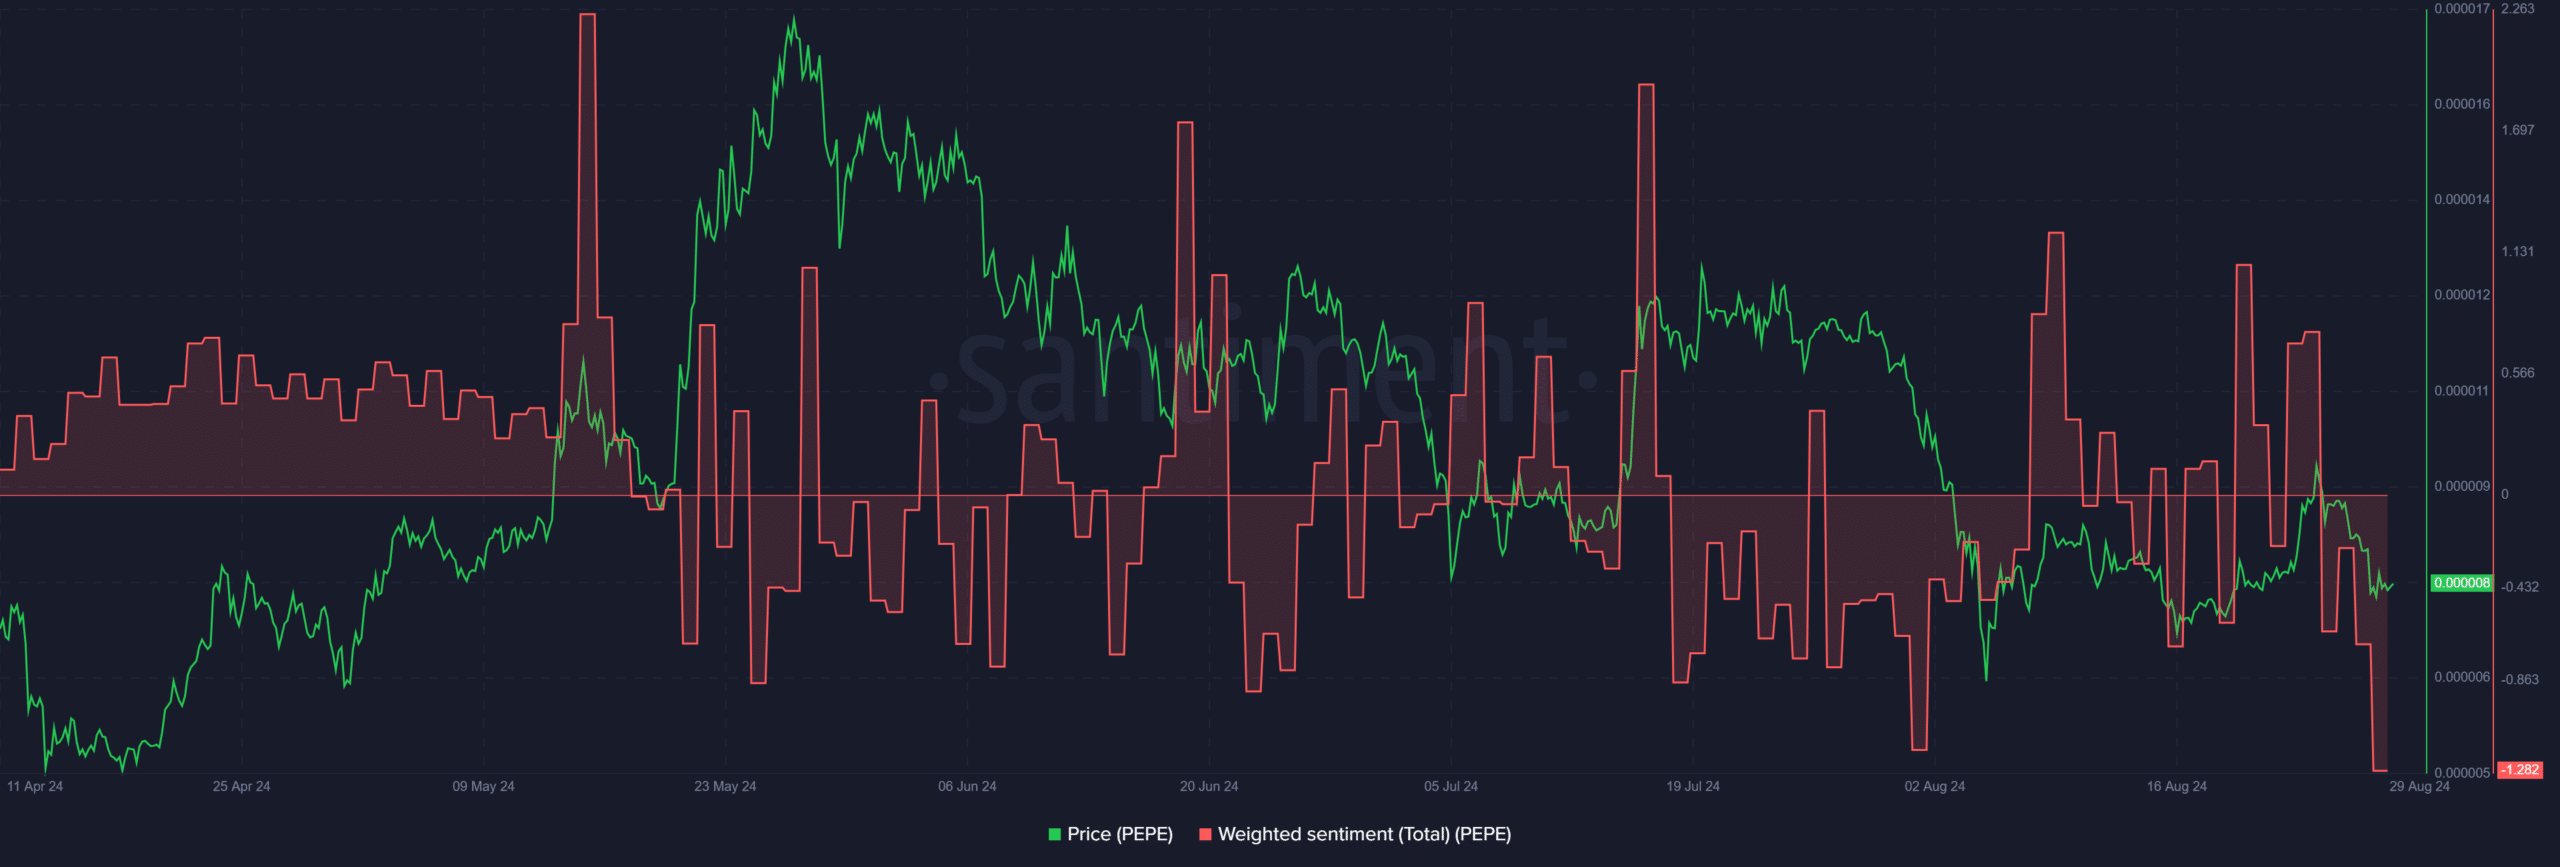
Source: Santiment
Key targets for PEPE
On the daily price chart, the Stochastic RSI (Relative Strength Index) indicated a potential price trend reversal as it edged closer to oversold condition.
A Fib retracement tool was plotted between April lows and June highs. Based on the tool, the 61.8% Fib level ($0.000009), marked red, was the immediate short-term bullish target.
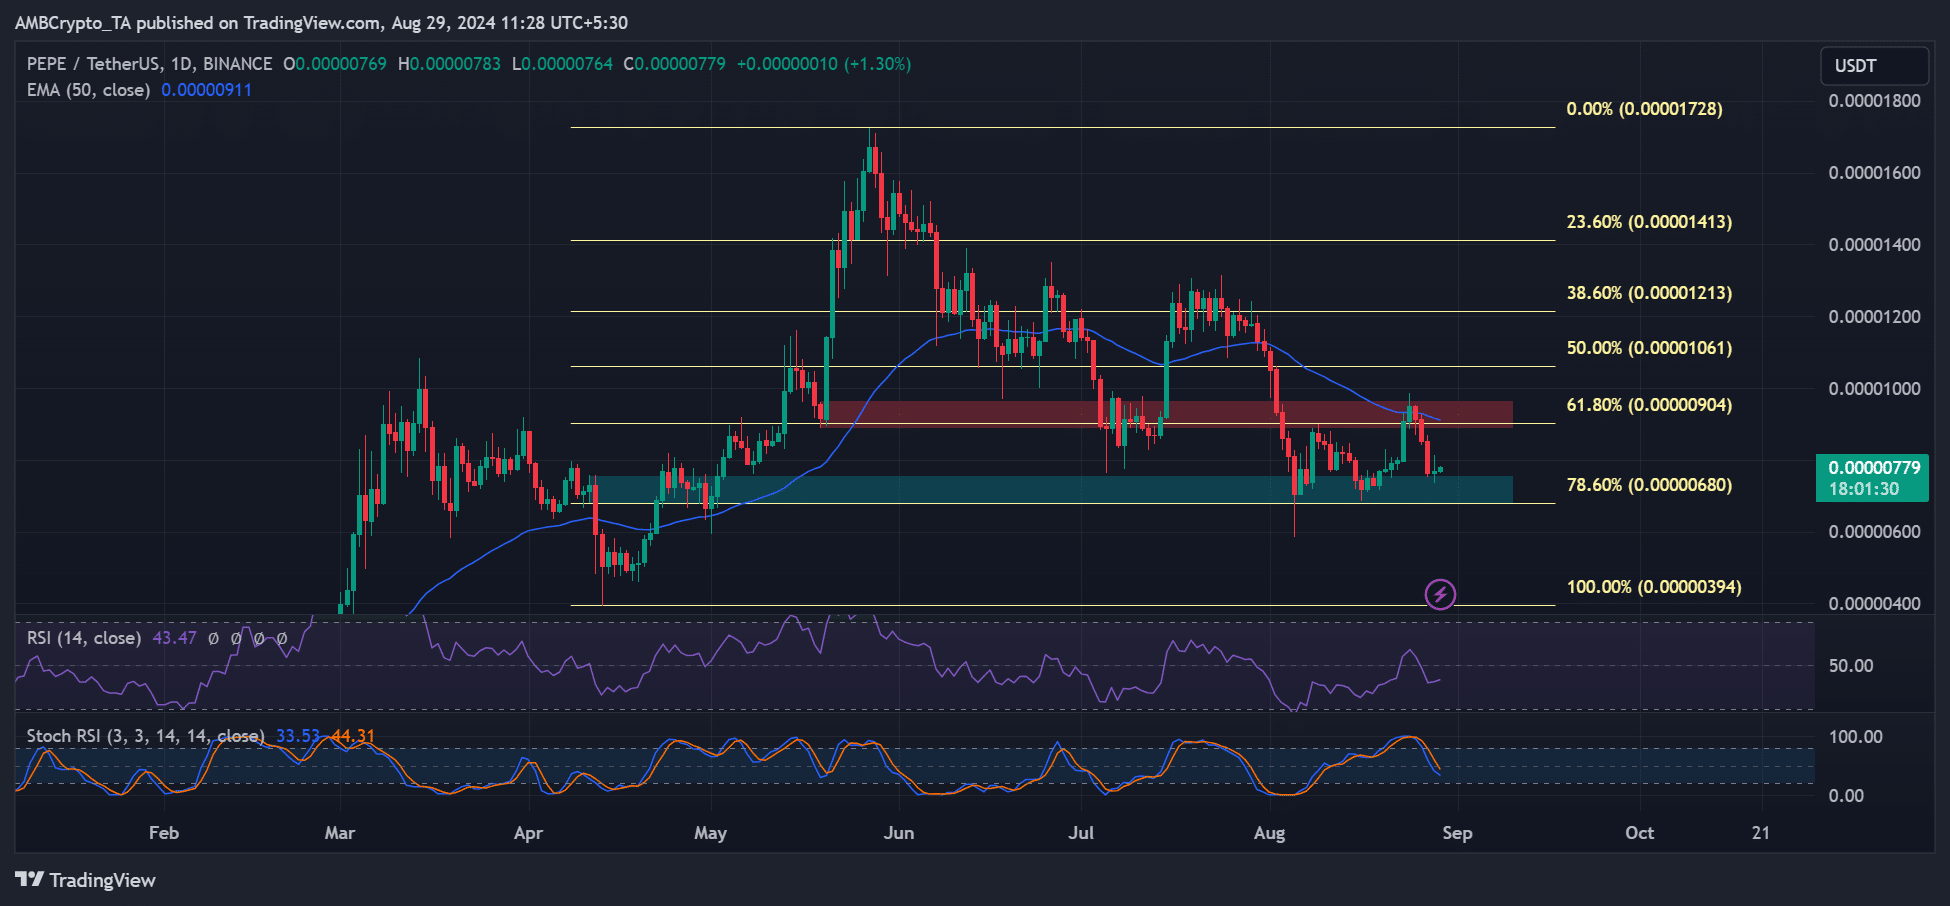
Source: PEPE/USDT, TradingView
It was also a breaker block that aligned with a 50-day EMA (Exponential Moving Average). It meant that it was a key short-term supply zone.
A bounce from the demand level (marked by cyan) at 78.6% Fib level ($0.0000068) to the supply zone would tip a potential +30% recovery gain.
Read Pepe [PEPE] Price Prediction 2024 – 2025
However, a breach below the demand area would invalidate the above bullish thesis.
In conclusion, PEPE was relatively at a discount and key demand interest level, which might have informed the recent whale move.