How AVAX’s recent gains could mould its near, long-term trajectory

Disclaimer: The findings of the following analysis are the sole opinions of the writer and should not be considered investment advice.
Over the last four days, there has been an improvement in broader market sentiment. As a result, Avalanche [AVAX] noted an up-channel recovery while the bulls heightened their pressure.
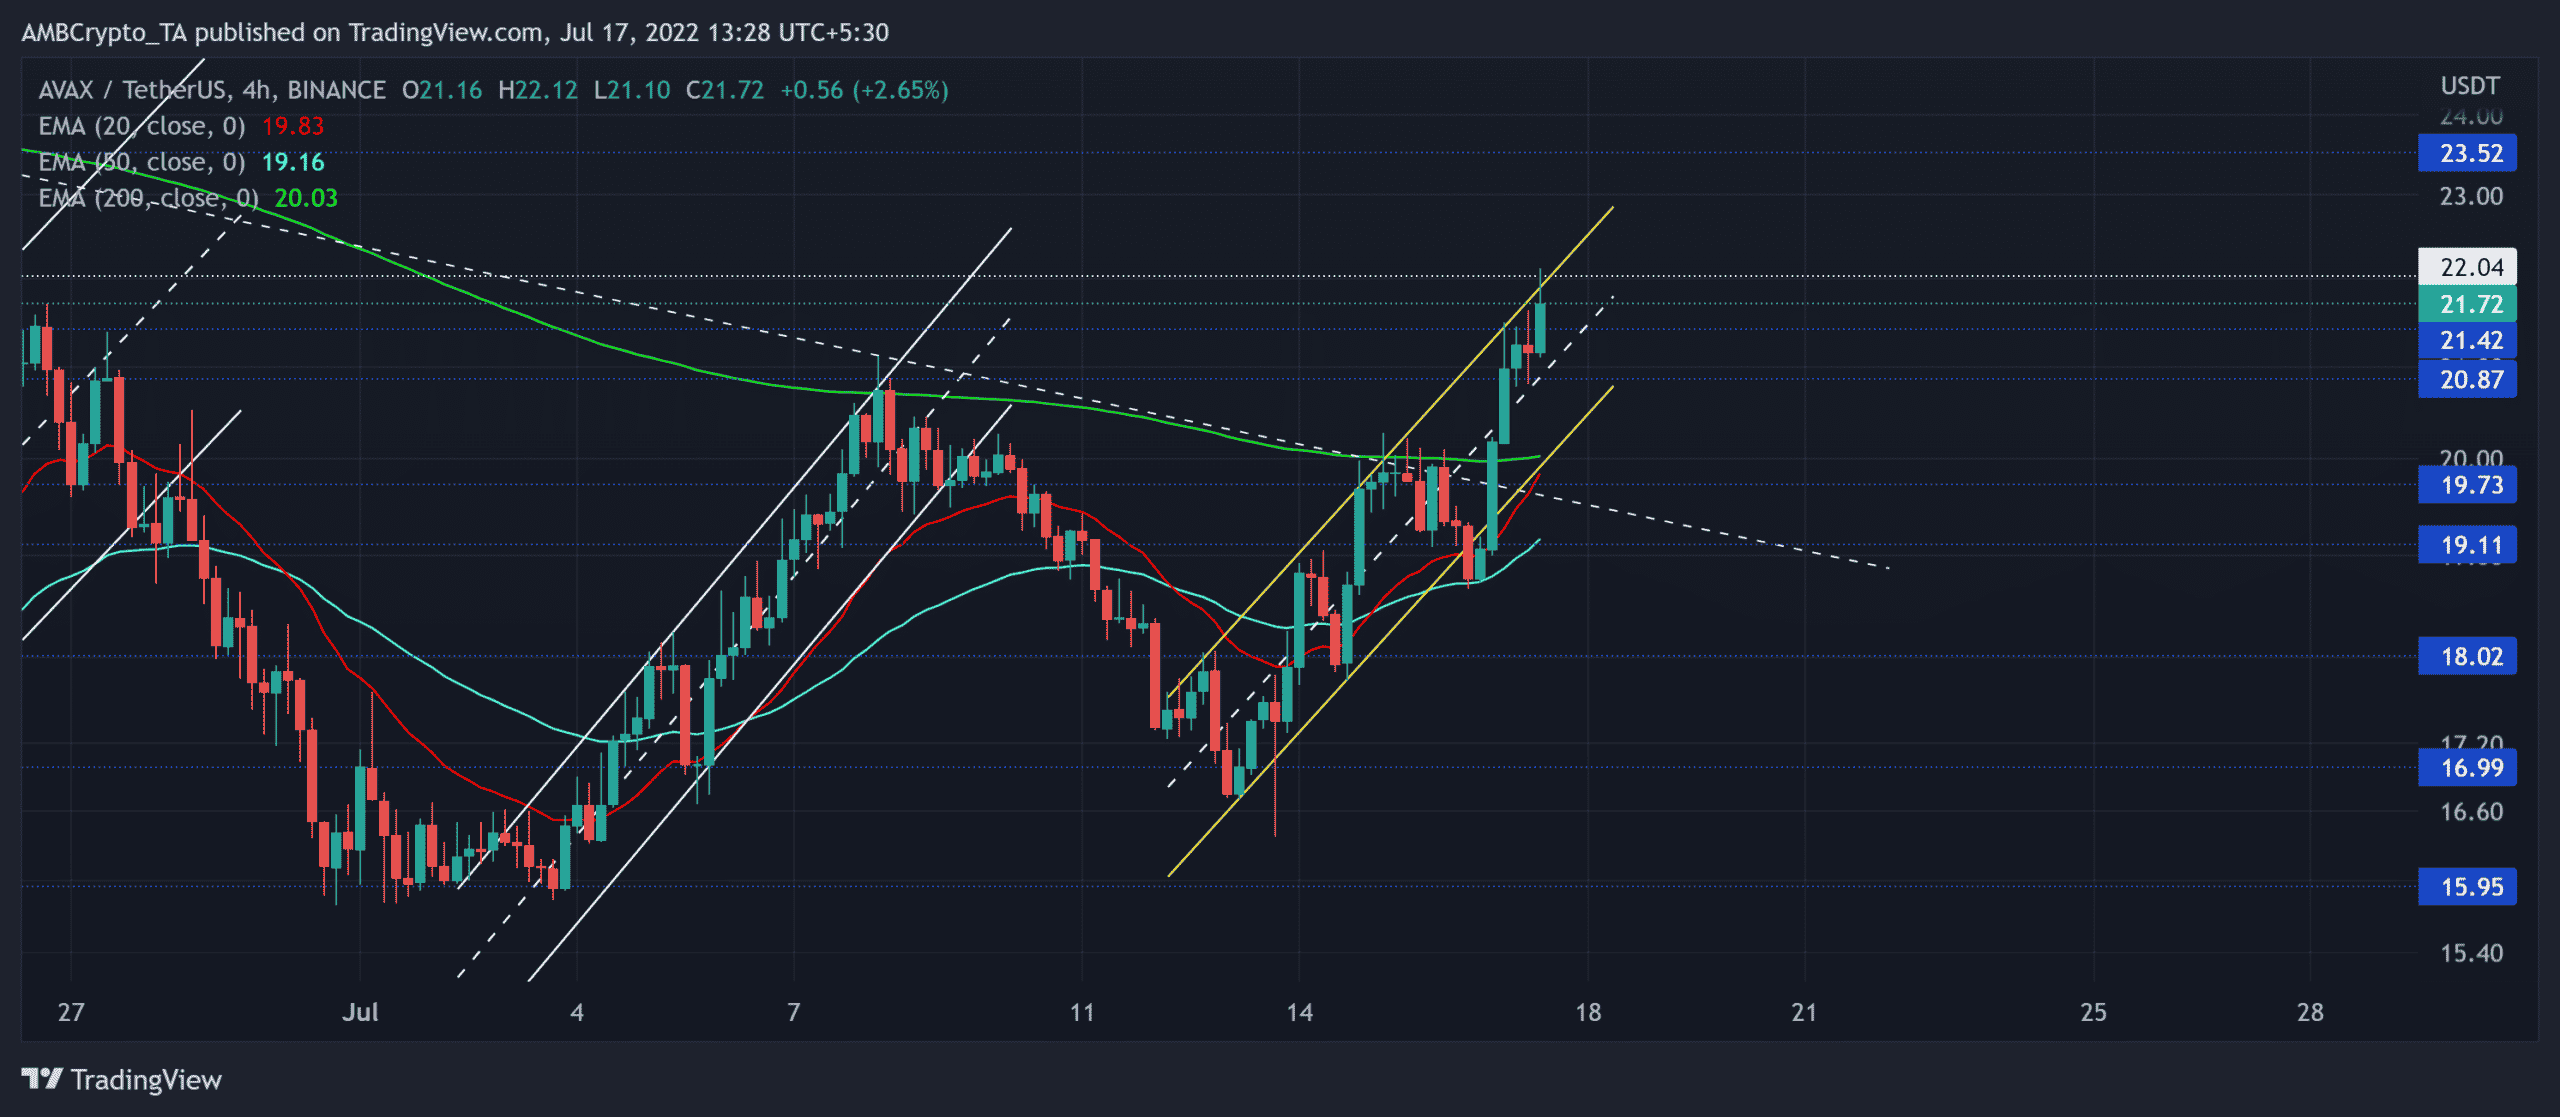
Also, the altcoin flipped the two-month trendline resistance to support while jumping above the 20/50/200 EMA. A convincing close below the $22-ceiling could compel a retest of the two-month trendline support in the coming sessions.
At press time, AVAX was trading at $21.72, up by 14.75% in the last 24 hours.
AVAX 4-hour Chart
AVAX shed more than half its value (from 23 May) and dived towards its ten-month low on 19 June. Since then, buyers have inflicted higher troughs on the chart. However, the altcoin saw multiple up-channel recoveries that struggled to close above the $22-resistance.
The buyers finally made decent efforts to alter the bearish narrative to their fancy while they found a close above the trendline support.
Furthermore, the price finally found a spot above the 200 EMA (green) after three months. With the 20 EMA (red) looking north, any bullish crossovers would only reaffirm the buying strength in the coming days.
However, the price action now approached the $22-level. So, a likely reversal from this zone could cause a near-term pullback.
A robust close below the upper trendline of the up-channel could pull AVAX to retest the $20-mark. Any close below this level would affirm a breakdown from the pattern. In this case, the immediate trendline resistance near the $19.1-$19.3 range could cushion the drawdowns.
Rationale
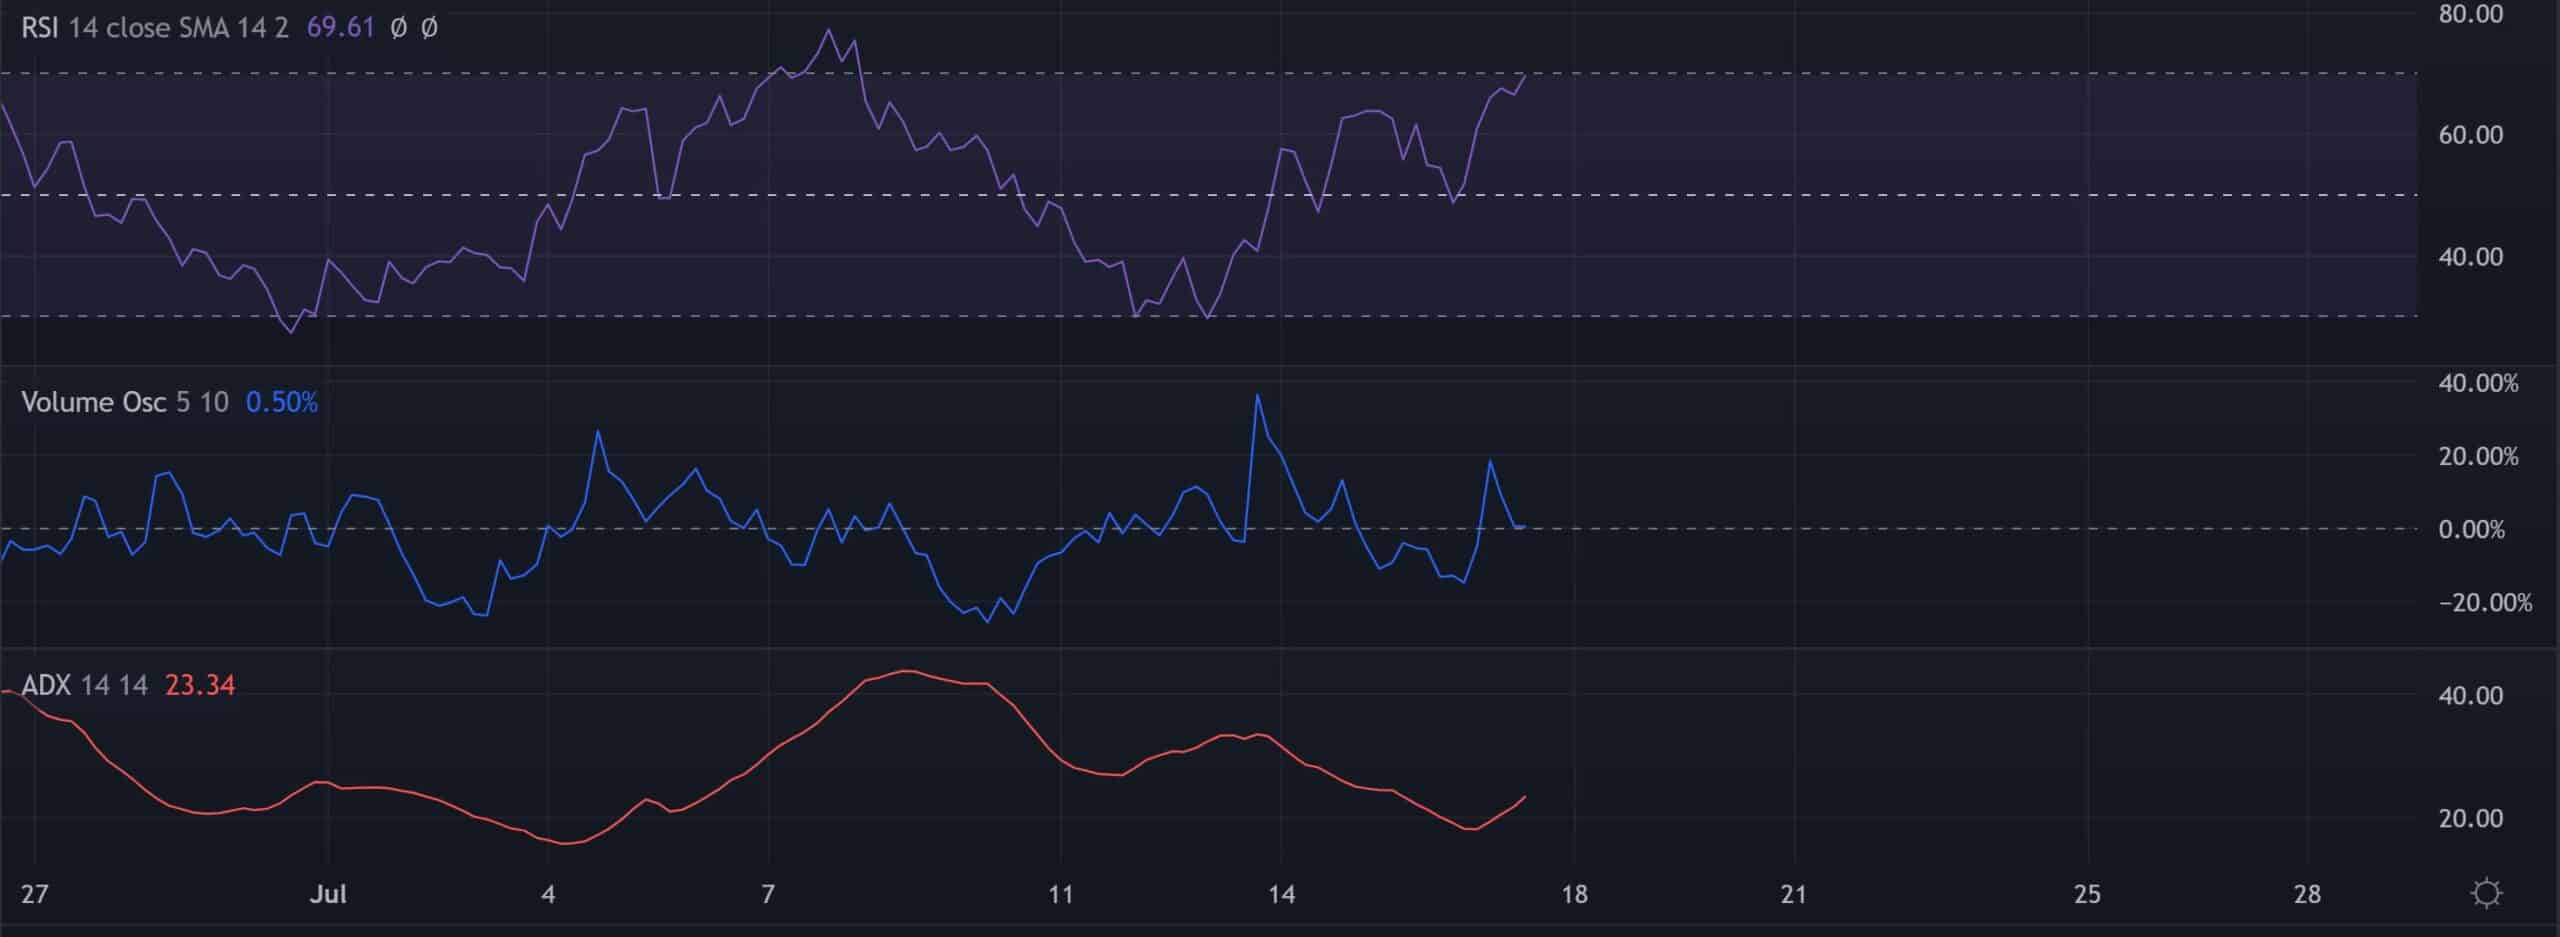
The Relative Strength Index (RSI) resonated with the recently increased buying power while being at the brink of the overbought zone. A potential reversal from this level could be plausible. This reversal could help buyers curb the excess near-term buying pressure.
Also, recent gains on the chart accompanied lower peaks on the volume oscillator (VO). This revealed a bearish divergence and a relatively weak bullish move. Nevertheless, the ADX displayed a slightly weak directional trend for AVAX.
Conclusion
In view of the overbought reading on the RSI alongside the bearish divergence on the VO, AVAX could see a near-term slowdown. However, the long-term narrative could aid buyers should the near-term EMAs jump above the 200 EMA. The targets would remain the same as discussed above.
Finally, a broader sentiment analysis alongside on-chain developments should be taken into consideration to make a profitable move.


