Altcoin
How Bitcoin Cash’s whale transactions could steer recovery
A month after its incredible rally, BCH’s price is nowhere near the peak initially reached. But certain indicators suggest a possible comeback.
- Whales exchanged a high number of BCH between wallets.
- Although Open Interest decreased, BCH’s momentum was bullish.
On 7 August, Bitcoin Cash [BCH] recorded its highest number of transactions within the $100,000 range since 13 July. These large-scale movements by whales often garner significant attention. But hopes of a price spike among market participants have yet to materialize, raising questions about their potential influence on price action.
Is your portfolio green? Check the Bitcoin Cash Profit Calculator
Driving the change in movement
Well, the actions in the derivatives market suggest that the average traders still expect a change from BCH’s recent downtrend. An indicator that suggested this was the coin’s funding rate.
Funding rates are periodic payments made by longs or shorts in order to keep their futures or options contracts open. When the funding rate is positive, it means traders are bullish on the price action.
Conversely, a negative funding rate implies a bearish stance. At press time, BCH’s funding rate had left the negative territory and hopped into the positive region.
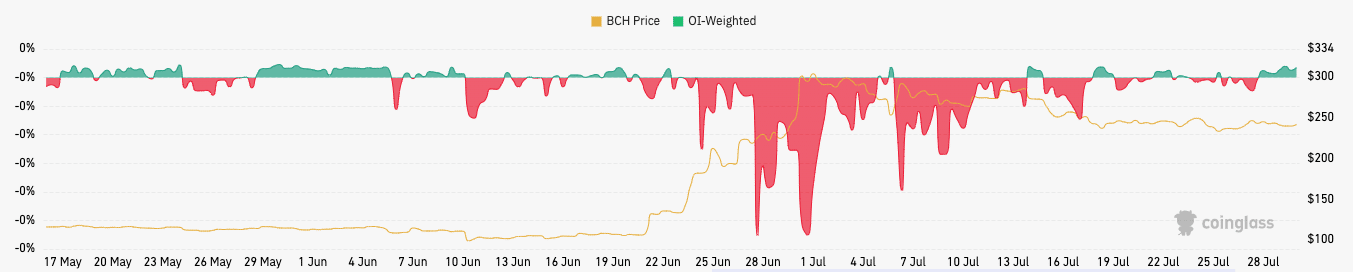
Source: Coinglass
From the chart above, the sentiment of traders was that BCH could soon reclaim $300, and probably push above it. At the time of writing, the coin exchanged hands at $239.87— an 11.62% decrease in the last 30 days.
Buyers on the wheel
BCH was the star performer on the market a month ago. At the time, Bitcoin Cash’s Open Interest (OI) was close to its highest point of the year. Open Interest is the number of outstanding derivatives contracts that have not been settled.
When the OI increases, it signals an increase in liquidity. But when the Open Interest falls, it means that traders are closing their positions, and this negatively affects the volume in the market.
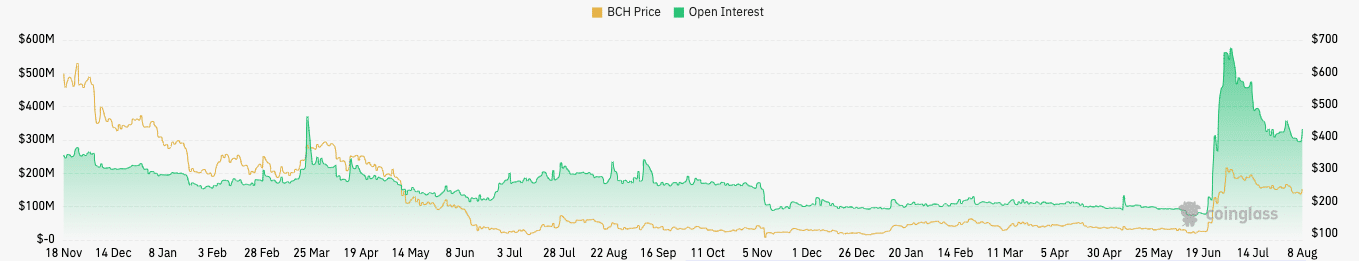
Source: Coinglass
Between 2 July and press time, BCH’s Open Interest took a big fall. This means that price movement is slowing down and BCH’s recovery to $300 may not be quick.
As per the price action, the 4-hour BCH/USD chart showed that buyers were in control of the market. This was indicated by the status of the Moving Average Convergence Divergence (MACD).
Read Bitcoin Cash’s [BCH] Price Prediction 2023-2024
At press time, the MACD was 1.74, as the blue dynamic line was above the orange line. A negative MACD implies that the 12-day EMA is lower than the 26-day EMA. This suggests a bearish bias.
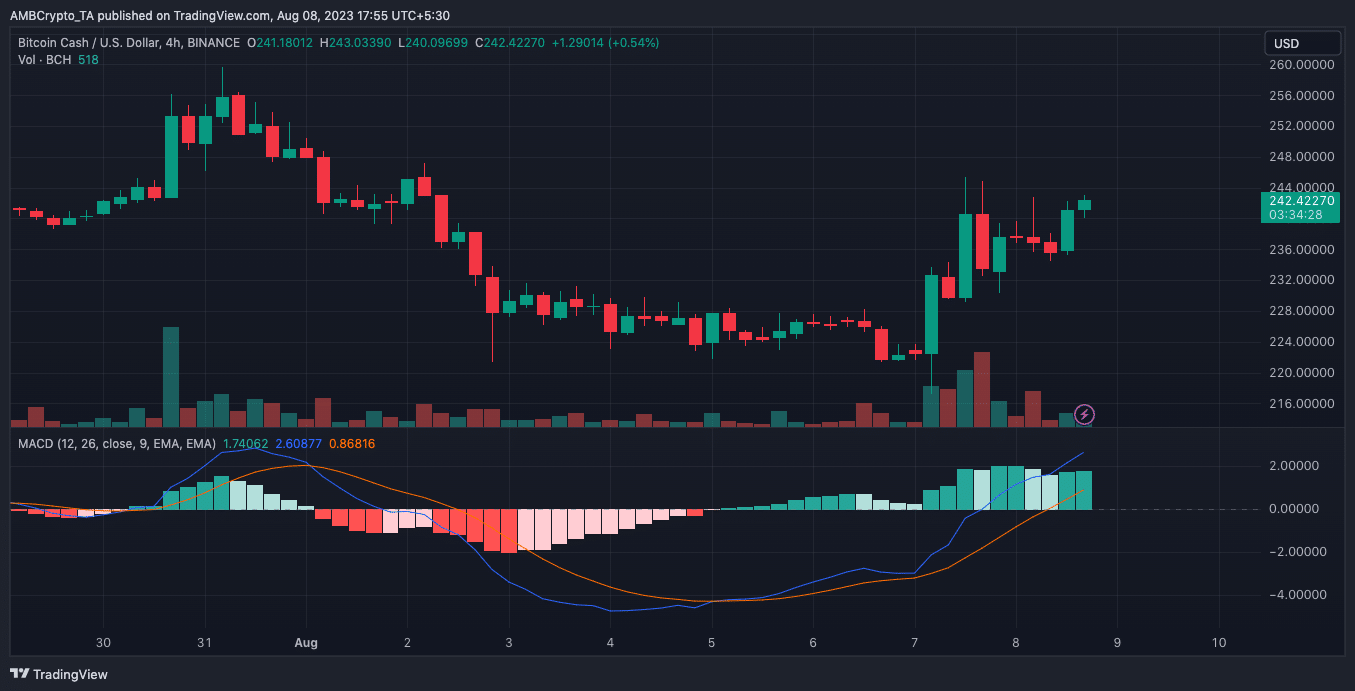
Source: TradingView
But the positive values of the indicator suggest bullish momentum. So, as it stands traders may want to refrain from opening short BCH positions.


![Is Tezos [XTZ] crypto poised for a correction? Key data says...](https://ambcrypto.com/wp-content/uploads/2024/11/Chandan-XTZ-400x240.webp)