- Metrics revealed that selling sentiment around Bitcoin was dominant.
- Most market indicators also remained bearish.
Bitcoin [BTC] miners have initiated a selling spree over the last few days, which raised concerns about the coin’s price.
AMBCrypto had earlier reported that miner outflows had hit a 6-year high, which had resulted in over $1 billion worth of BTC being sent to exchanges. This trend was long-lasting, as the latest datasets also pointed to a sell-off.
Bitcoin miners are selling BTC
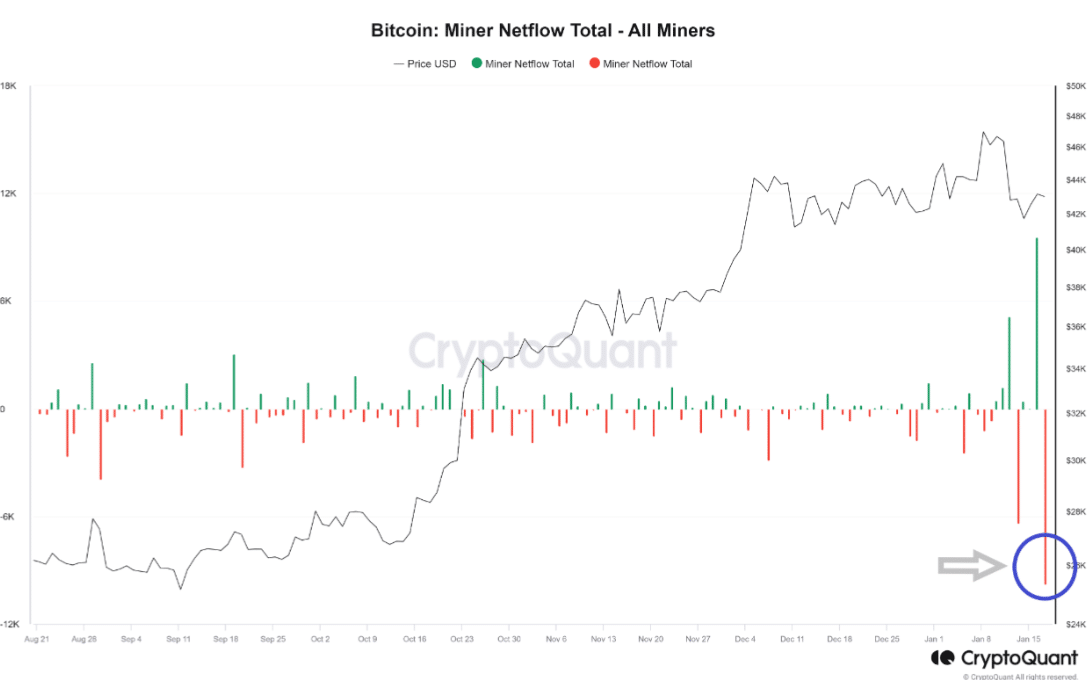
While BTC’s price remained under the $43,000 mark, miners were selling BTC. Inasmuch, as per a CryptoQuant analysis, the BTC miner netflow metric showed an influx of over 10,000 Bitcoins from miners’ wallets to exchanges recently.
This hinted that the possibility of miners selling BTC was high.
The analysis mentioned,
“This trend could signify miners’ strategies for securing long-term operational funds. Selling Bitcoin on the market to offset mining and operational costs is a typical part of their business activities.”
Such large sell-offs by miners have the potential to have a variety of market effects, including short-term changes in the price of Bitcoin. Therefore, to understand whether another price correction was on its way, AMBCrypto checked BTC’s metrics.
Is another price drop inevitable?
Our look at CryptoQuant’s data revealed that BTC’s Miners Position Index (MPI) increased substantially. This further established the fact that miners were selling BTC.
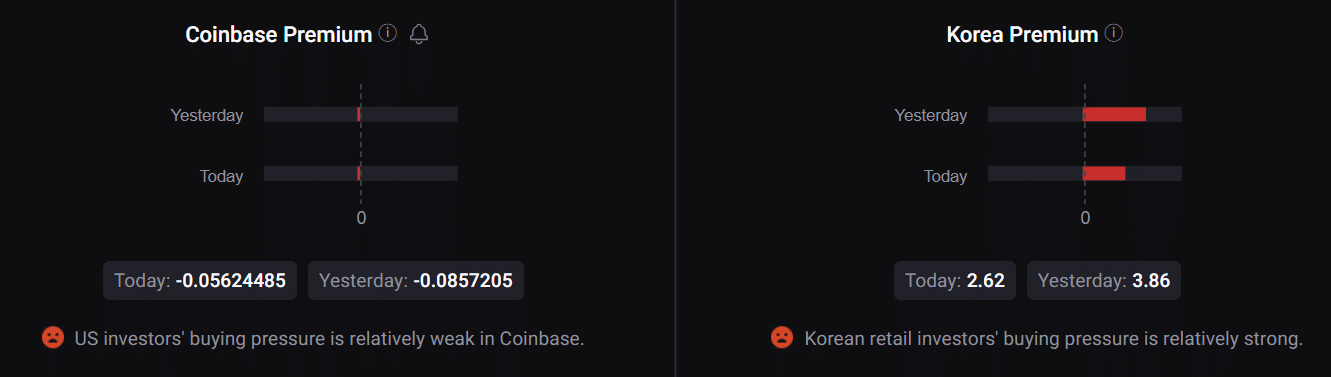
The overall market sentiment around BTC also looked bearish, as both BTC’s Coinbase premium and Korea premium were in the red.
Things in the derivatives market also looked bearish, as BTC’s taker buy/sell ratio was in the red, meaning that selling sentiment among derivatives investors was high.
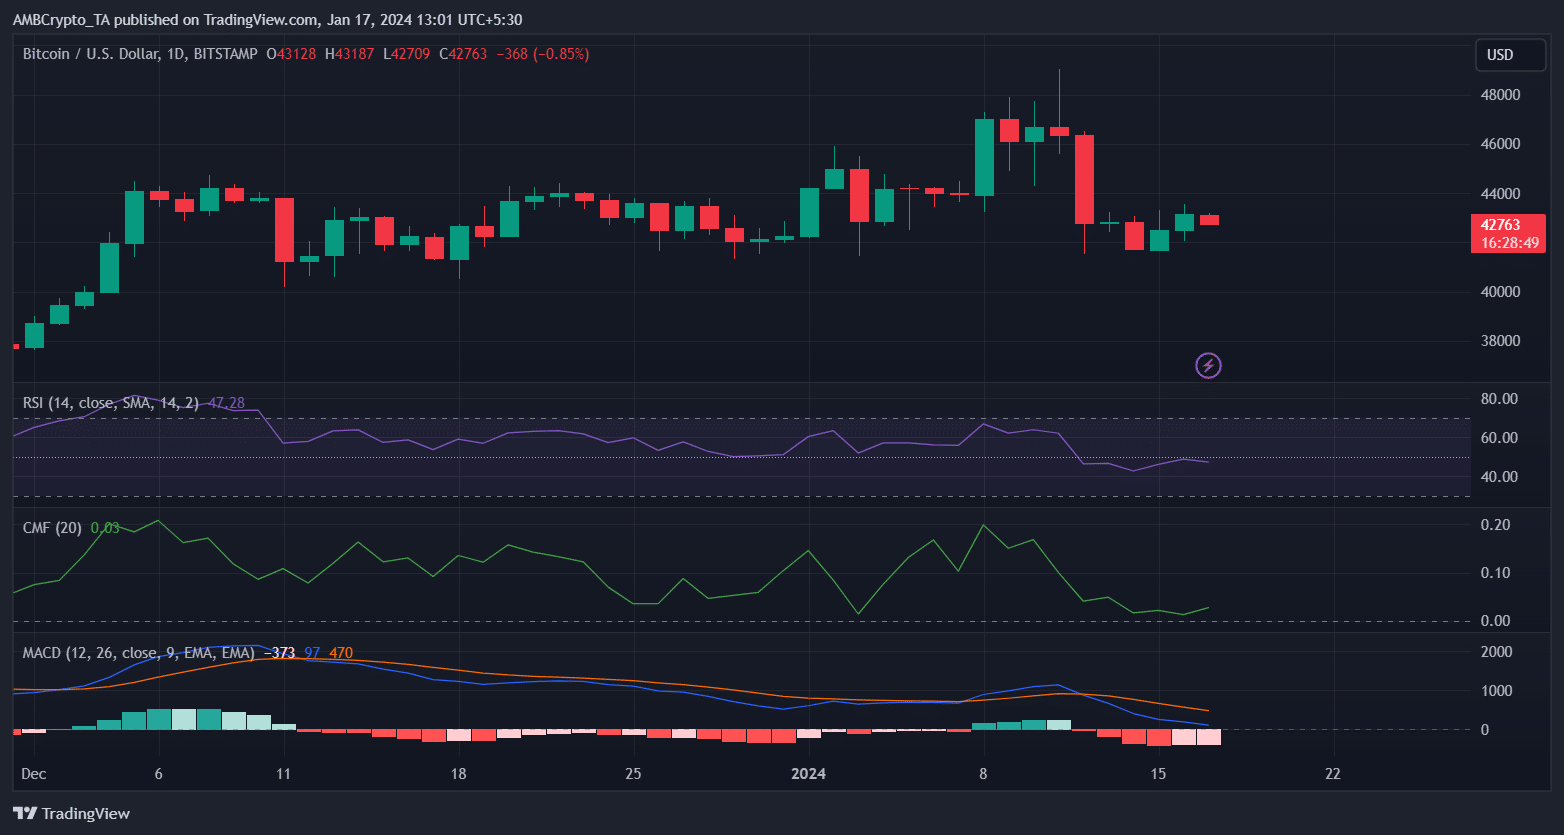
AMBCrypto then moved to TradingView to check Bitcoin’s daily chart, which revealed that the king coin’s MACD displayed a bearish crossover.
Is your portfolio green? Check out the BTC Profit Calculator
Its Relative Strength Index (RSI) also registered a downtick and was headed further below the neutral mark, showing increased chances of a price decline. However, the Chaikin Money Flow (CMF) went northward.
According to CoinMarketCap, at the time of writing, BTC was trading at $42,803.52 with a market capitalization of over $838 billion.