
‘Risks to inflation are tilted to the upside’: Can Bitcoin ride this to $120K?

- ADA’s long-term bearish trend continued as it fell below the 200-day EMA, but near-term volatility could offer some opportunities to buyers.
- The altcoin’s Funding Rates pointed toward an ease in selling pressure.
The broader sentiment seemed to deteriorate for Cardano [ADA] over the past day as the Crypto Fear & Greed Index entered the ‘Extreme Fear’ zone.
After witnessing a streak of red candles, it finally chalked out a bullish reversal pattern on its daily chart. But will it be enough for the bulls to change the bearish narrative?
ADA traded at $0.4 at the time of writing, up by around 2% over the past day.
Can Cardano reverse the ongoing bearish trend?
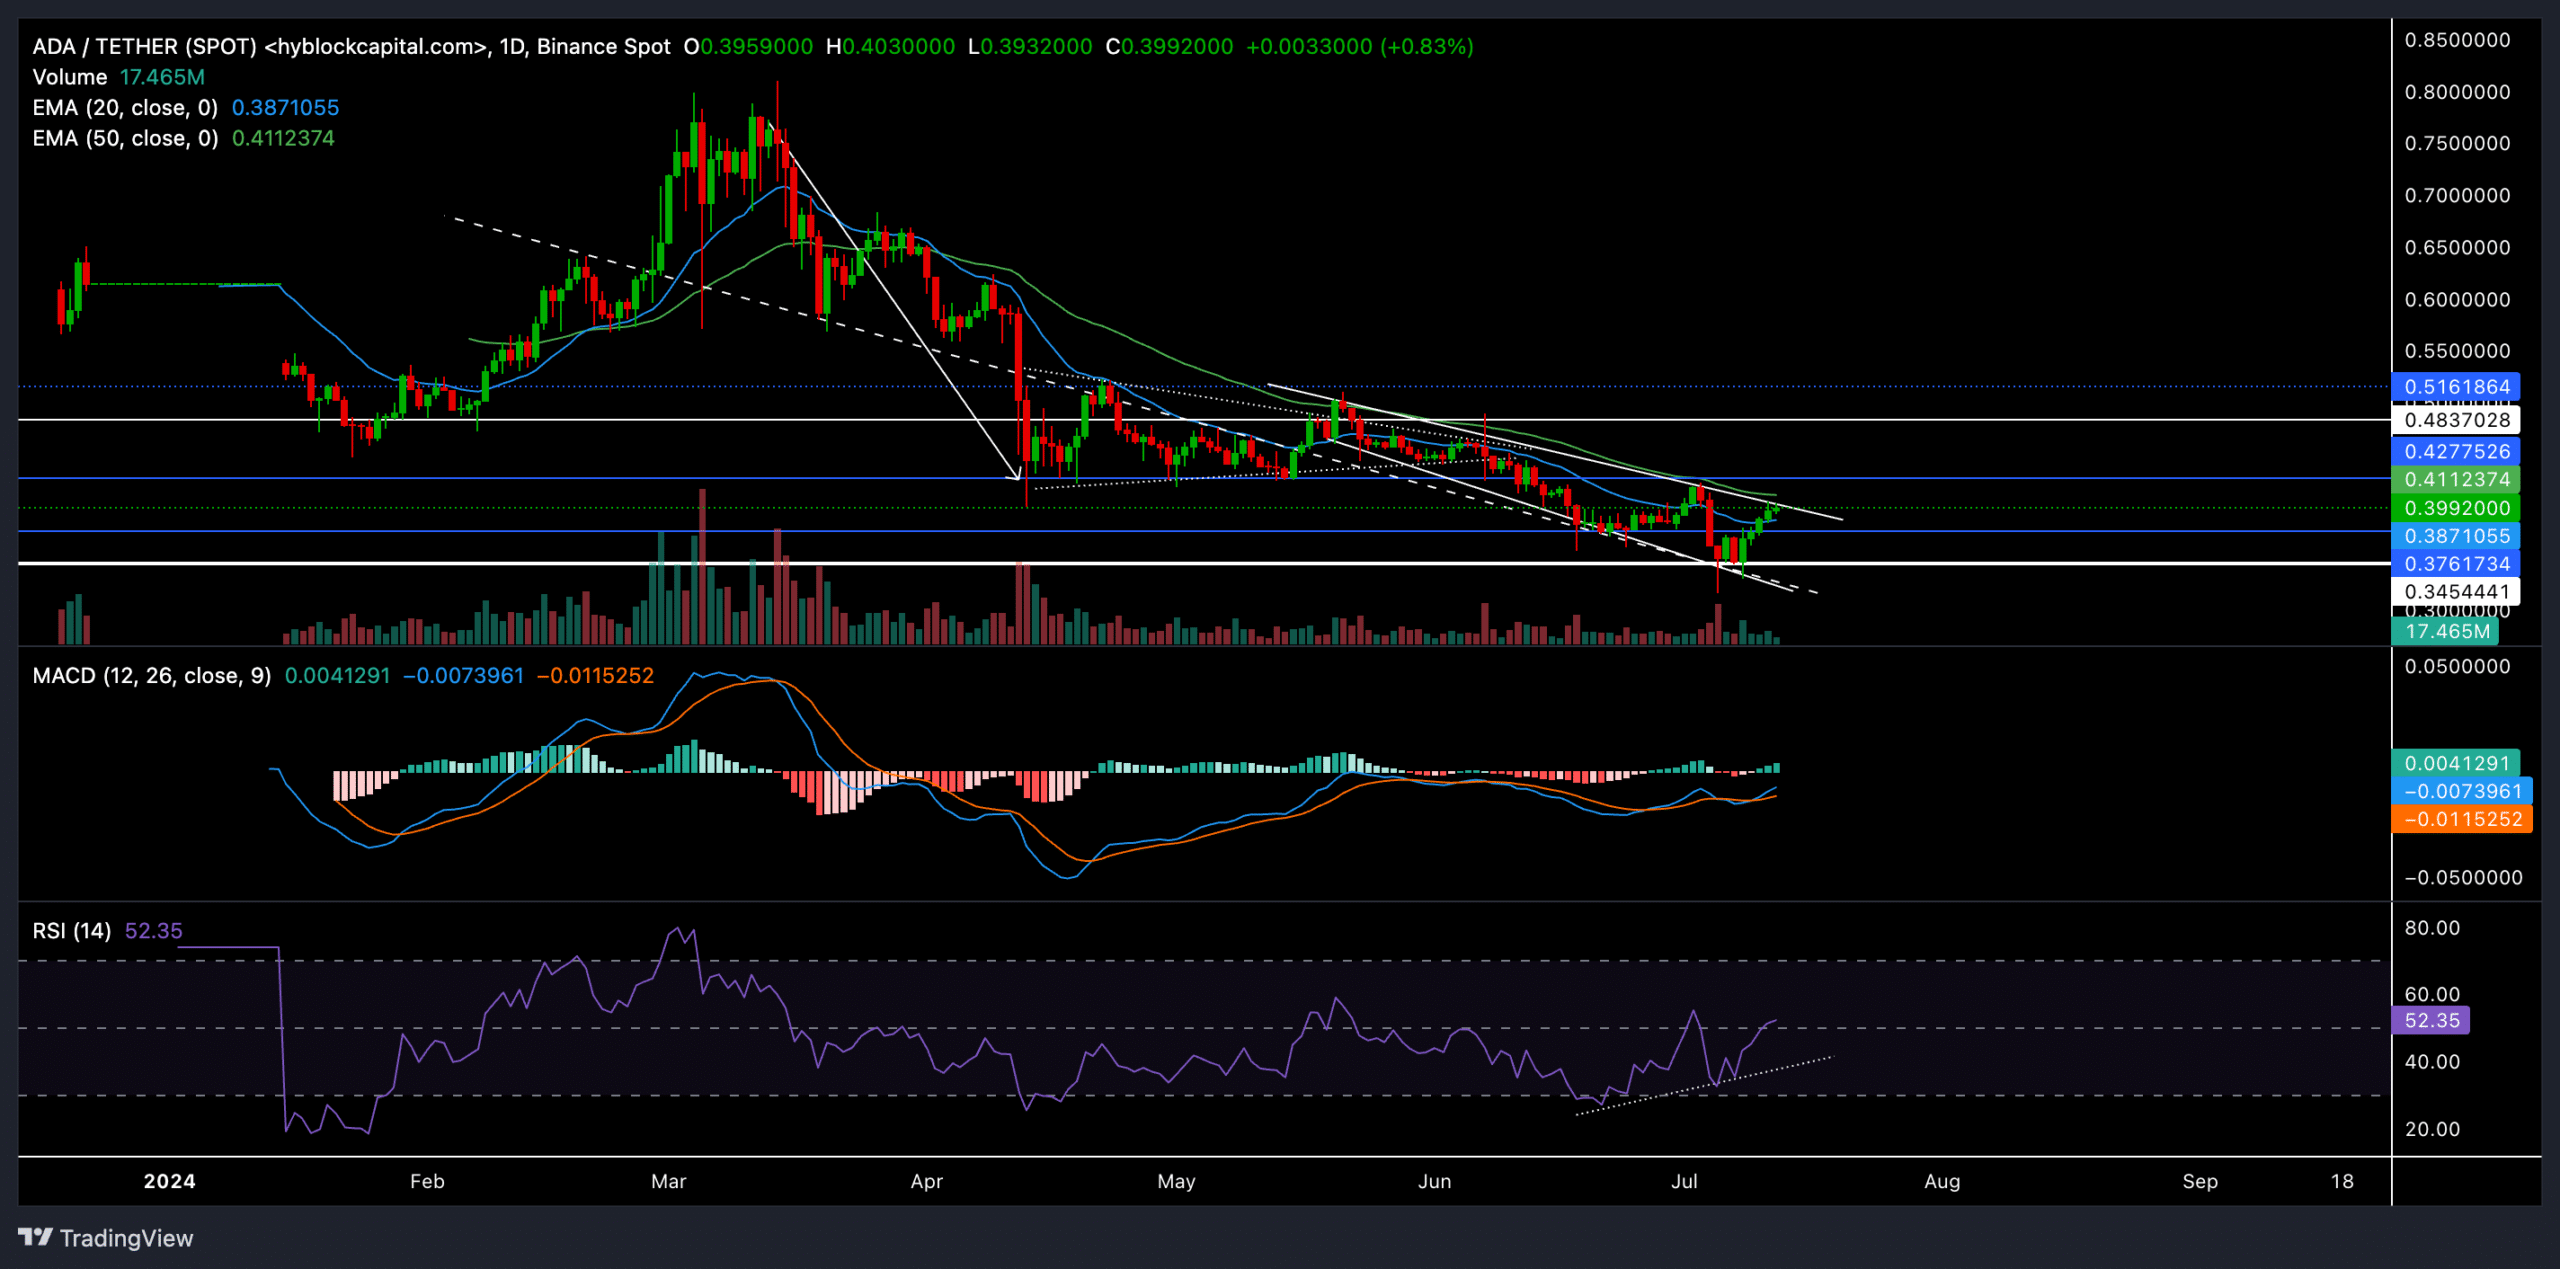
Source: TradingView, ADA/USDT
ADA had entered a relatively long-term bearish trend, especially after it fell below its crucial 200-day EMA support level.
It’s worth noting that ADA’s 200 EMA has now become a major resistance level for the coin’s recovery.
For instance, ADA recently witnessed a classic bearish pennant pattern after rebounding from this resistance level on its daily chart.
However, buyers can capitalize on the coin’s near-term volatility as it strives to break the chains of its 20-day and 50-day EMAs.
The $0.34 support level has offered strong immediate support, which the sellers have tested multiple times over the past week.
The latest rebound from this support has chalked out a descending, broadening wedge on the charts. Consequently, over the past four days, the coin saw an over 15% jump and defied the broader market uncertainty.
A close above the current pattern will likely confirm a near-term bullish breakout. Buyers should wait for a close above the 20-day and 50-day EMA to confirm this breakout.
In this case, ADA would likely look to test the $0.48 resistance before making any committal moves.
However, if the broader market sentiment continues to take a hit, the coin could test the next main support level at $0.304.
The Relative Strength Index (RSI) finally closed above the 50-level mark to show an ease in selling pressure. This occurred after it marked a bullish divergence with the price action.
While the MACD lines did see a bullish crossover, they were yet to jump above the equilibrium. Any close above the equilibrium can set the stage for bulls to make a strong comeback.
Funding Rates marked an uptrend

Source: Coinglass
According to Coinglass data, ADA’s funding rates on all exchanges have been consistently on an uptrend over the past week. This revealed a gradual increase in bullish power.
Read Cardano’s [ADA] Price Prediction 2024-25
In fact, even the Open Interest for ADA has surged over the past day alongside the increase in daily price, suggesting many traders are entering new positions.
Please note that ADA shared an 84% correlation with Bitcoin in the past 60 days. Thus, it’s crucial to consider BTC’s sentiment before entering new positions.


