How dropping down to $24,000 could be bullish for Bitcoin

While selling pressure has evidently continued to drop for Bitcoin over the past couple of weeks, BTC has hardly picked up any pace in the markets. It remained under $34,000 at press time and hasn’t been able to test the $36,000 range since 29th June. The sideways movement continued to dominate its price charts, while some Altcoins have represented a mixed bag of results over the past few days.
However, key signs continue to rise which suggest that traders are getting less and less worried about more selling pressure for Bitcoin.
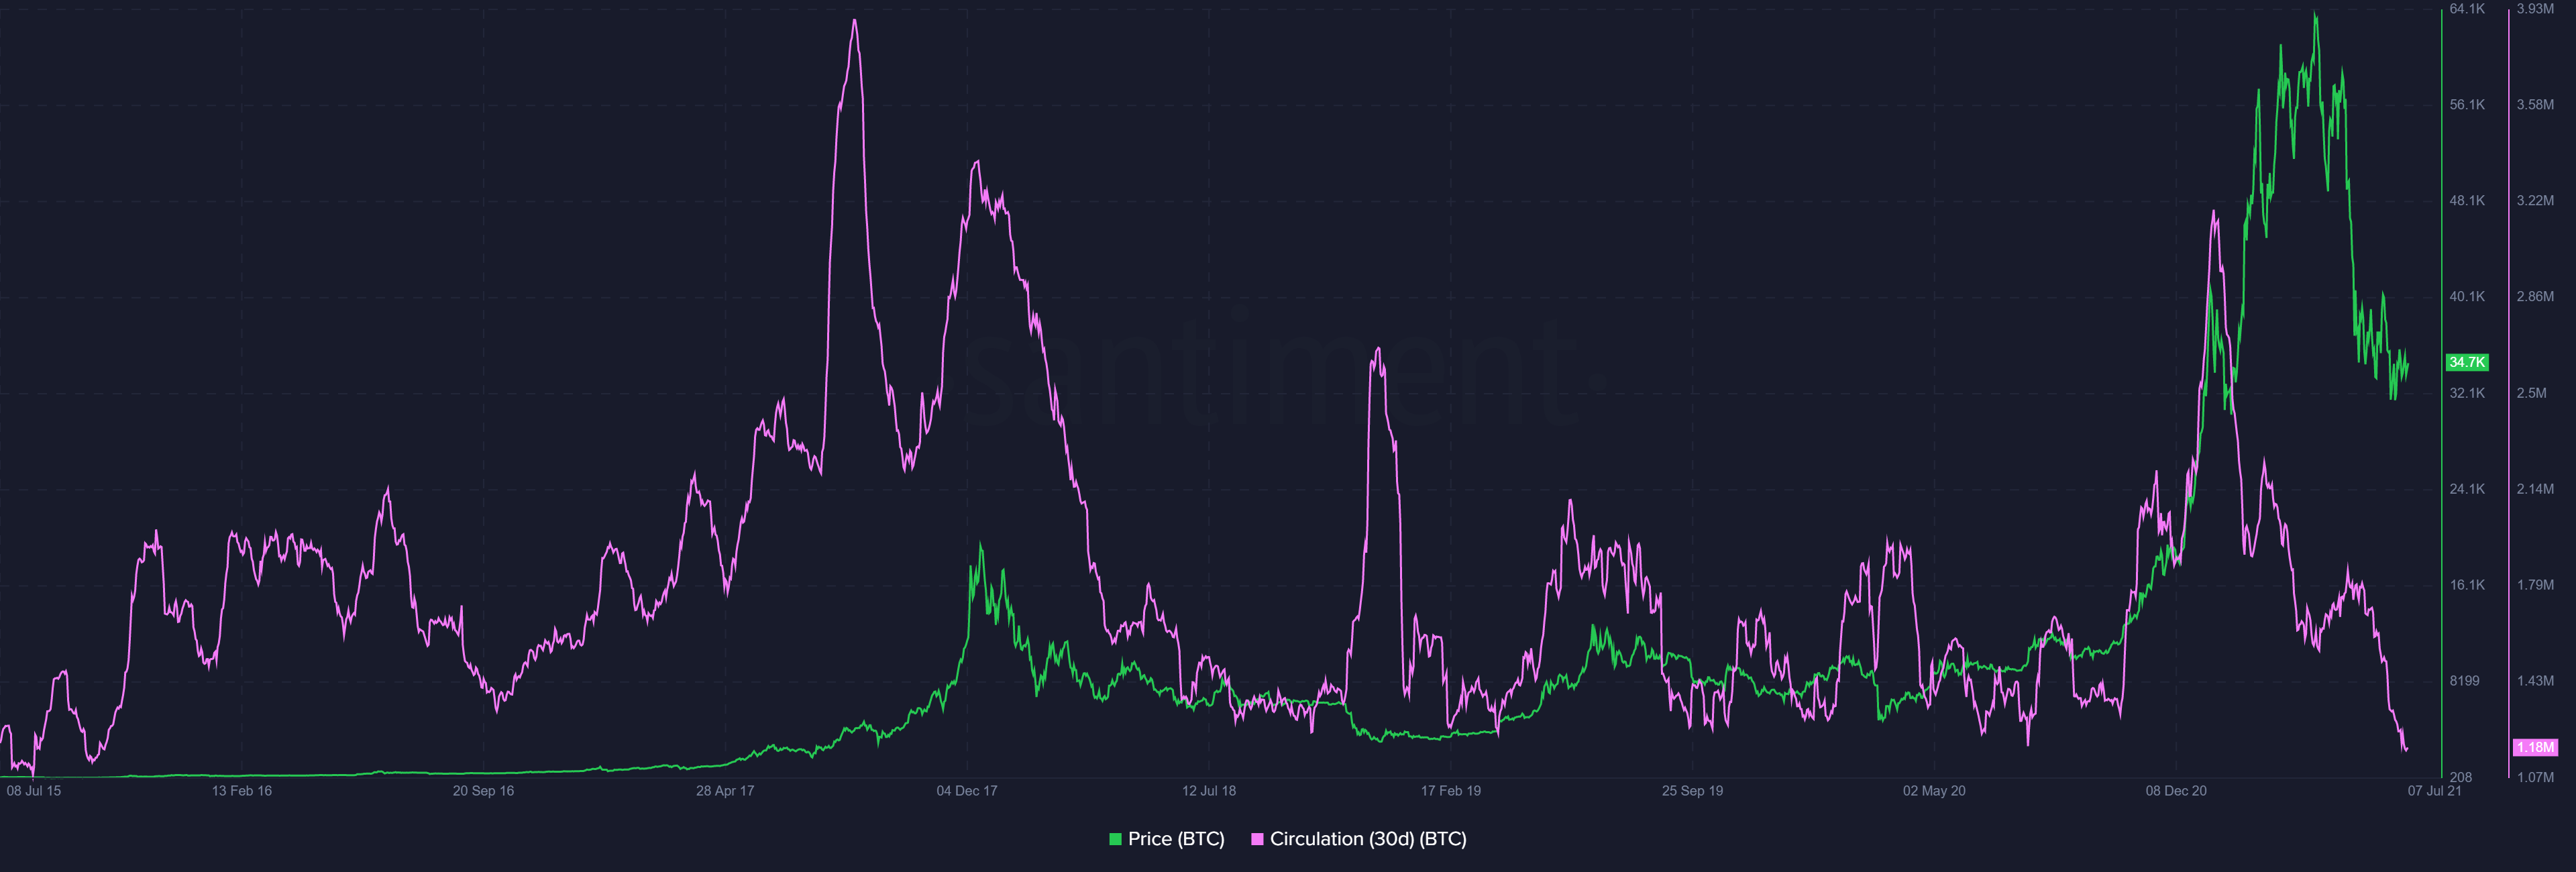
Bitcoin Circulation dropped to levels of October 2015
According to Santiment, Bitcoin’s circulation has dropped down to levels last noticed during October 2015. At press time, the circulation number has dropped down to 1.18 million after recording a high of 3.06 million in January 2021.
Now, circulation is basically the amount of time a unique BTC token has been moved or transacted daily. It is also important to note that a token moved 5 times in a day, it will be counted as one token circulation, and 5 times in terms of transaction volume.
Major inference that can be drawn from declining circulation is that traders have remained dormant over the past few weeks, which sits well with reducing sell pressure. Drawing similarities with another key indicator might allow new traders to gauge the situation better at press time.
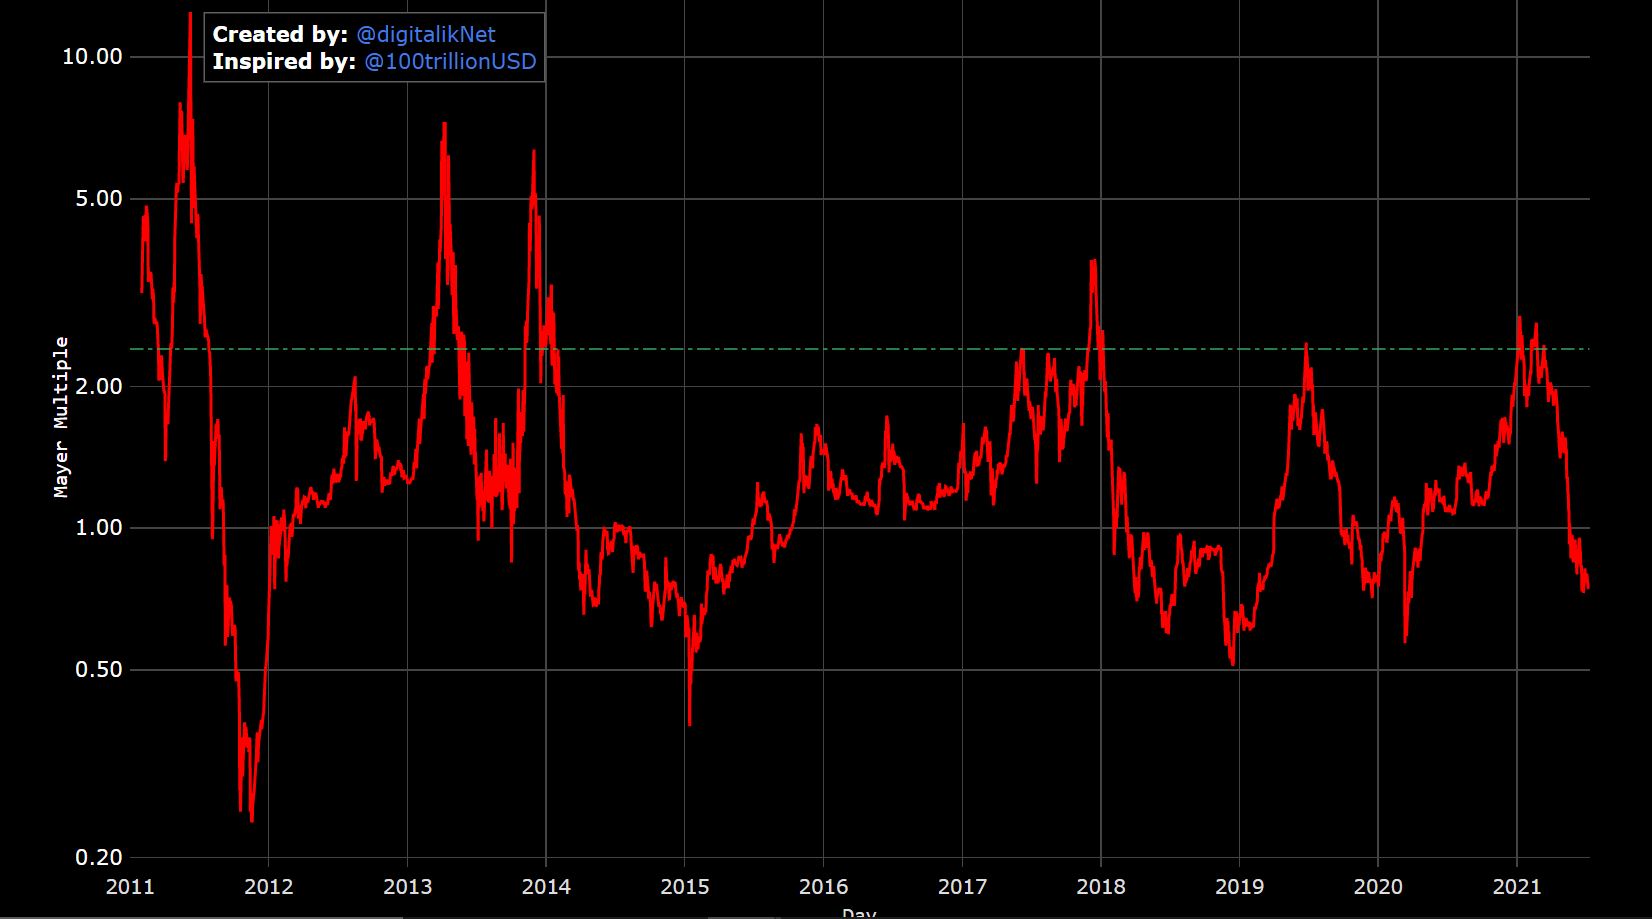
What does Mayer Multiple suggest?
Now, Mayer Multiple was created to analyze BTC’s price with respect to historical movement, and over time it has been identified that Bitcoin being accumulated when Mayer Multiple has been under 2.4, proved lucrative. At press time, the multiple stood at 0.75, and according to data, Mayer Multiple has been higher than today for 87% of the time.
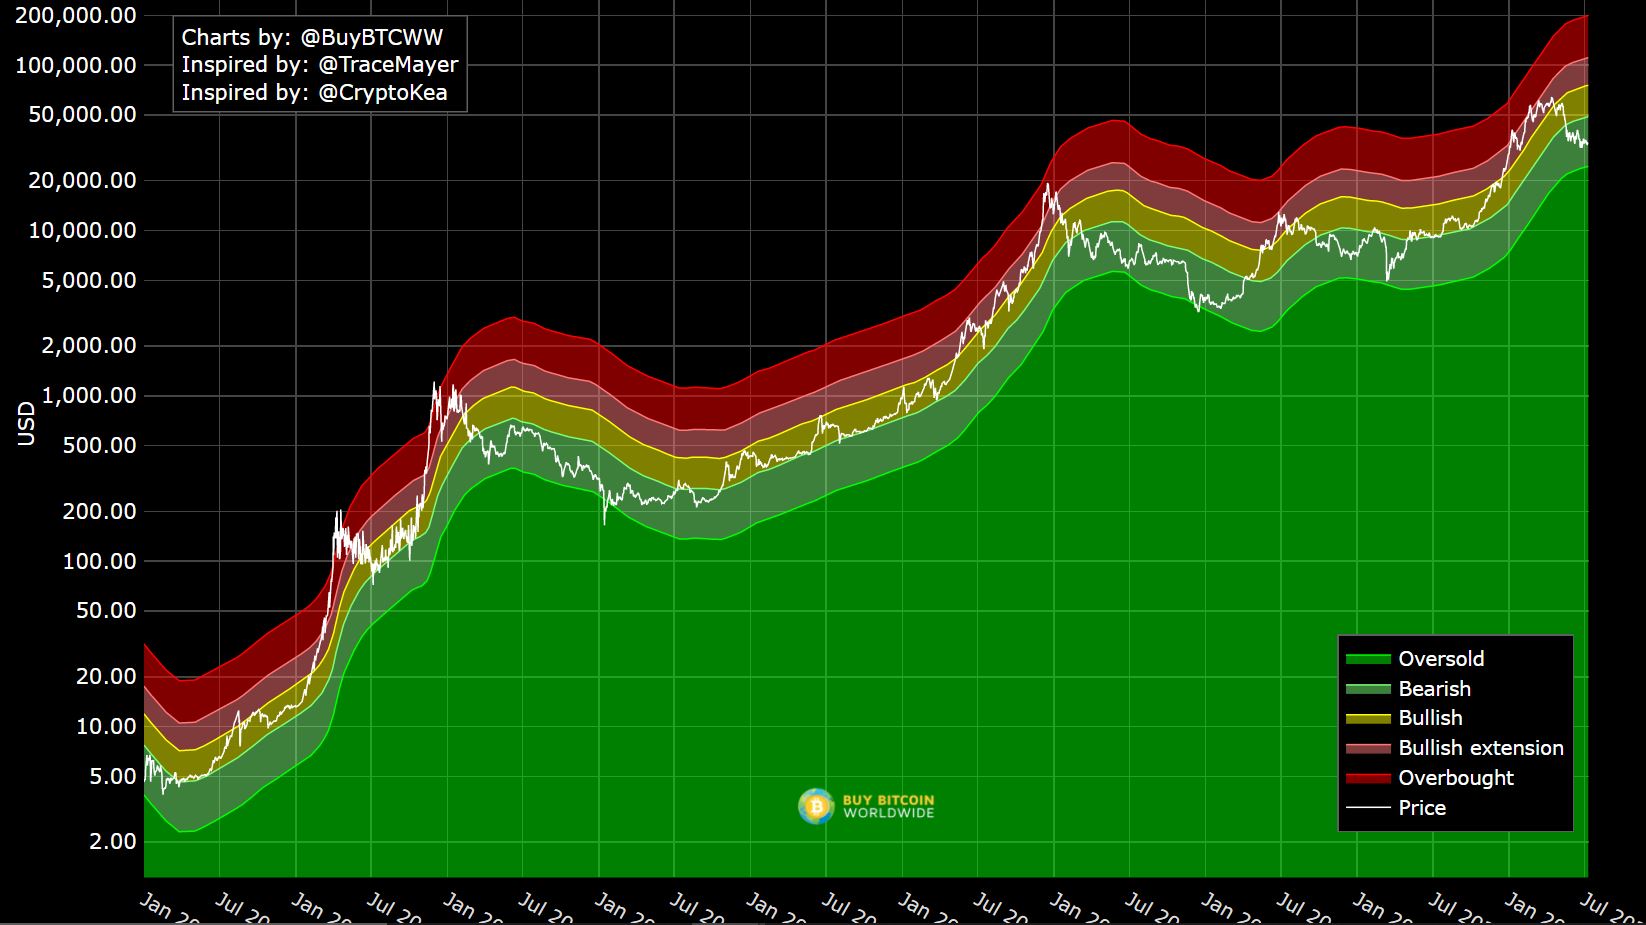
Now, from a point of market reversibility, the Mayer Multiple Bands indicated a better outlook.
Now, if the price movement is strictly observed, it is situated in the bearish zone at the moment, and over the past four times, BTC has always bounced back from this range. However, another key inference that can be drawn is that whenever the asset has dropped below in the bearish range, it has gone on to touch the oversold region. The oversold region is currently sitting under $25,000 for Bitcoin, which means that BTC might still correct over the short time.
Yet, these analyses should be taken with a grain of salt since several other factors play a decisive role in BTC’s recovery as well. A correction should not be expected solely based on MM but its insights cannot be ignored either.


