How Hedera [HBAR] bulls can capitalize on this pattern’s breach
HBAR recently broke out of its bearish pattern, can the bulls provoke an uptrend?
![How Hedera [HBAR] bulls can capitalize on this pattern’s breach](https://ambcrypto.com/wp-content/uploads/2024/07/News-Articles-FI-Editors-7.webp)
- After rebounding from the $0.06 support, HBAR broke out of its bearish pattern on the daily chart
- HBAR’s long/short ratio indicated a slight bullish edge
Hedera’s [HBAR] recent reversal from the $0.06 support level set the stage for the bulls to end their bearish rally. As a result, the altcoin finally broke out of its bearish pattern. It saw a few green candles on its daily chart over the past week as it attempted to break above its near-term EMAs.
Could the bulls provoke another rally from the $0.06 support level if the sellers cause a near-term pullback? At the time of writing, HBAR was trading at around $0.0722.
Can HBAR buyers provoke a bull run?
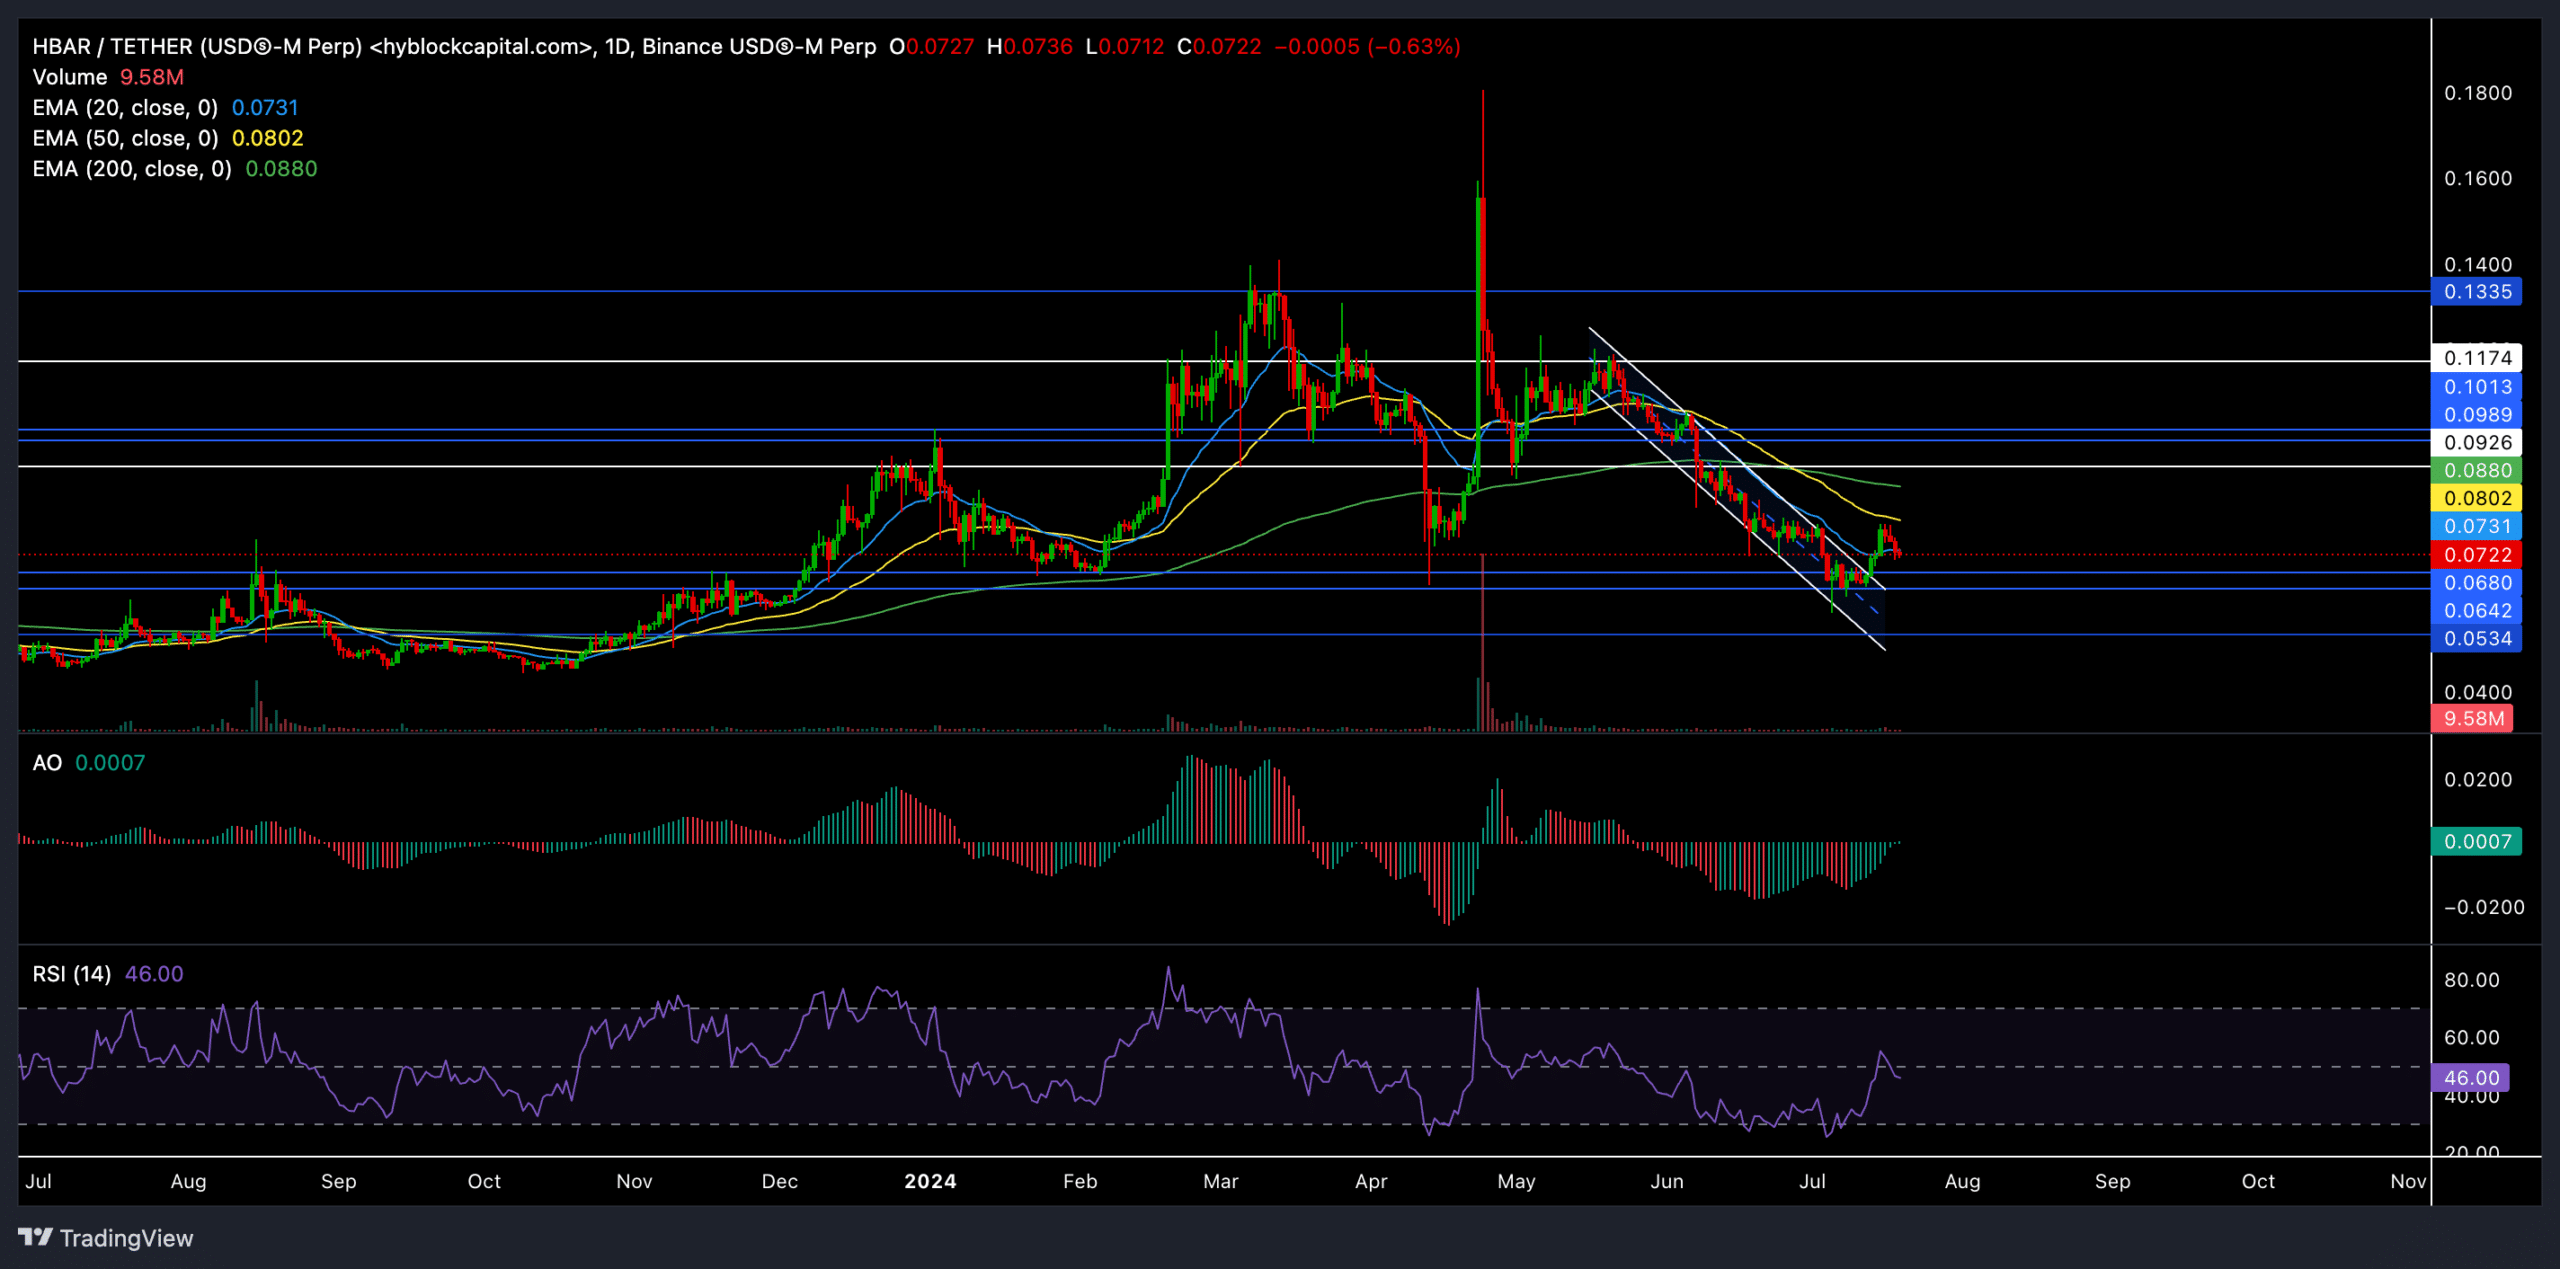
From a relatively long-term perspective, HBAR was on a consistent uptrend after jumping above its 200-day EMA (green) in October 2023. The altcoin kept marking higher troughs and highs and grew by over 164% in the next five months after that.
However, after losing the crucial $0.09 resistance (then support) level on the daily chart, HBAR registered a steep downtrend. As a result, it fell by over 23% over the past month.
After witnessing an increasingly bearish edge, it fell below its crucial 200-day EMA and formed a descending channel during this downtrend.
The recent buying resurgence from the $0.06 support level helped the buyers break the streak of red candles. Bulls provoked a 20% rally in four days, but the 50-day EMA (yellow) remains a strong hurdle.
Nonetheless, this resulted in a descending channel breakout, which can set the stage for buyers to provoke a near-term rally.
Should the bears retest the $0.06 level again, buyers will likely provoke an uptrend and aim to cross above the near-term EMAs. In this case, buyers would look to test the $0.088 level near the 200-day EMA.
A decline below the $0.06 support can significantly delay any near-term recovery attempts. Here, sellers would aim to pull the price towards the $0.05 level before a likely reversal.
Interestingly, the Awesome Oscillator marked two subsequent higher peaks, with another peak aiming to find a spot above the ‘0’ level. A sustained uptrend on this indicator can confirm bullish twin peaks, reaffirming our bullish bias.
However, at press time, the RSI had fallen below the 50 level and was yet to confirm a bullish edge. A hidden bearish divergence on this indicator will reveal a bearish edge.
HBAR in a critical spot

According to Coinglass data, the 24-hour Long/Short Ratio had a reading of 0.8515. This indicated a higher proportion of short positions, compared to long positions. However, the HBAR/USDT long/short ratio on Binance significantly highlighted a bullish edge, standing at 2.1.
Finally, most altcoins share a strong correlation with Bitcoin. So, it’s crucial to consider Bitcoin’s movements and assess the overall sentiment before making a buying decision.