How high can WAVES go at the back of this recent demand

Disclaimer: The findings of the following analysis are the sole opinions of the writer and should not be considered investment advice
The market structure for Waves in recent weeks has been strongly bullish, although the past few days have seen a pullback for WAVES. Bitcoin also pushed toward a resistance zone at $45k and could see rejection in the near term. Rejection of a move past $45k for BTC, in either scenario, WAVES exhibited a more bullish outlook than sellers being strong. A move toward $35-$37 could be on the cards for WAVES in the next few days.
WAVES- 1H
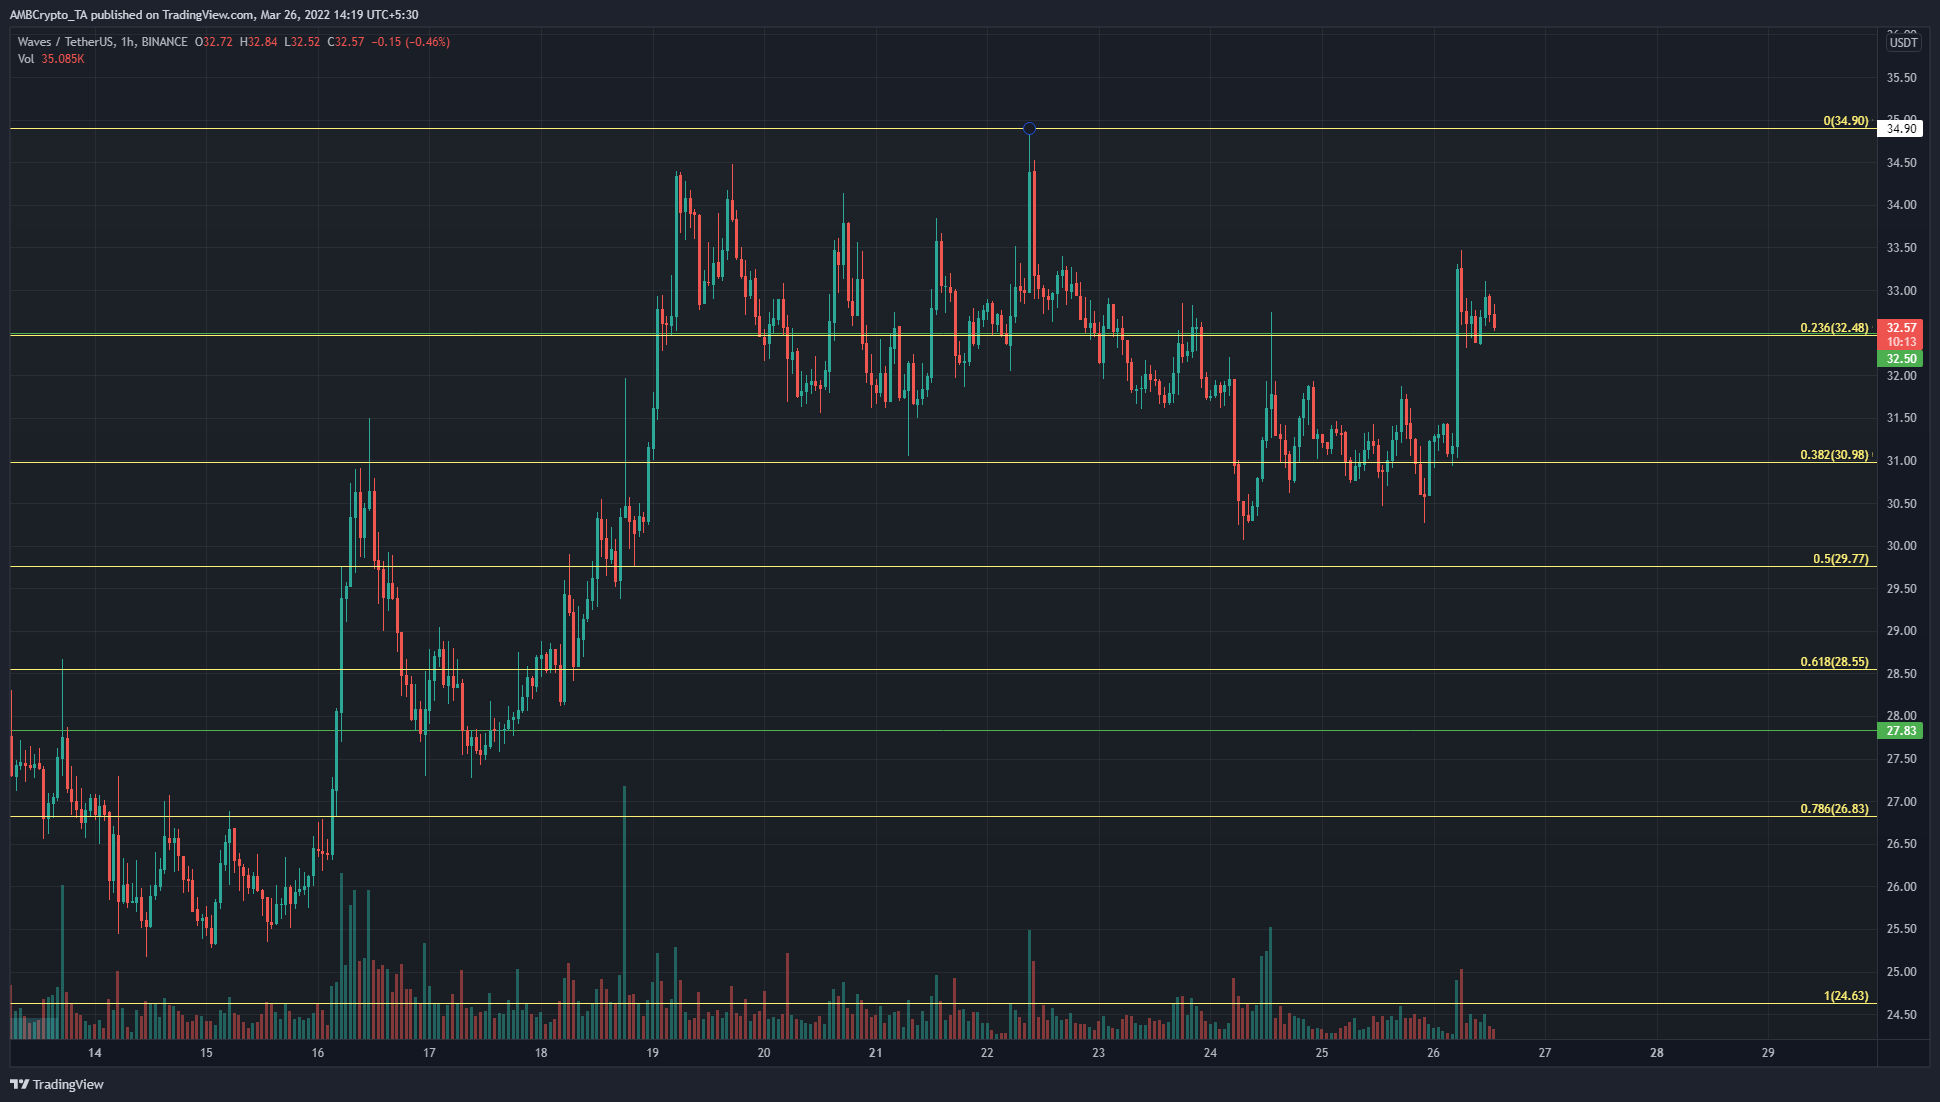
In the past week, the price has been unable to breach the $34.9 resistance level, and at the same time, it has found some support at the $32.5 and $31.67 levels. Using the swing low and swing high at $24.63 and $34.9, a set of Fibonacci retracement levels (yellow) were plotted.
Apart from $31.67, $31 and $32.48 were plotted as retracement levels of this move. But where is the trend of WAVES headed? In the past week, it has been sideways and lower, which suggested some minor pullback in progress. In the past few hours, the price broke past the $32.5 resistance area as well and could be headed higher once again.
Rationale
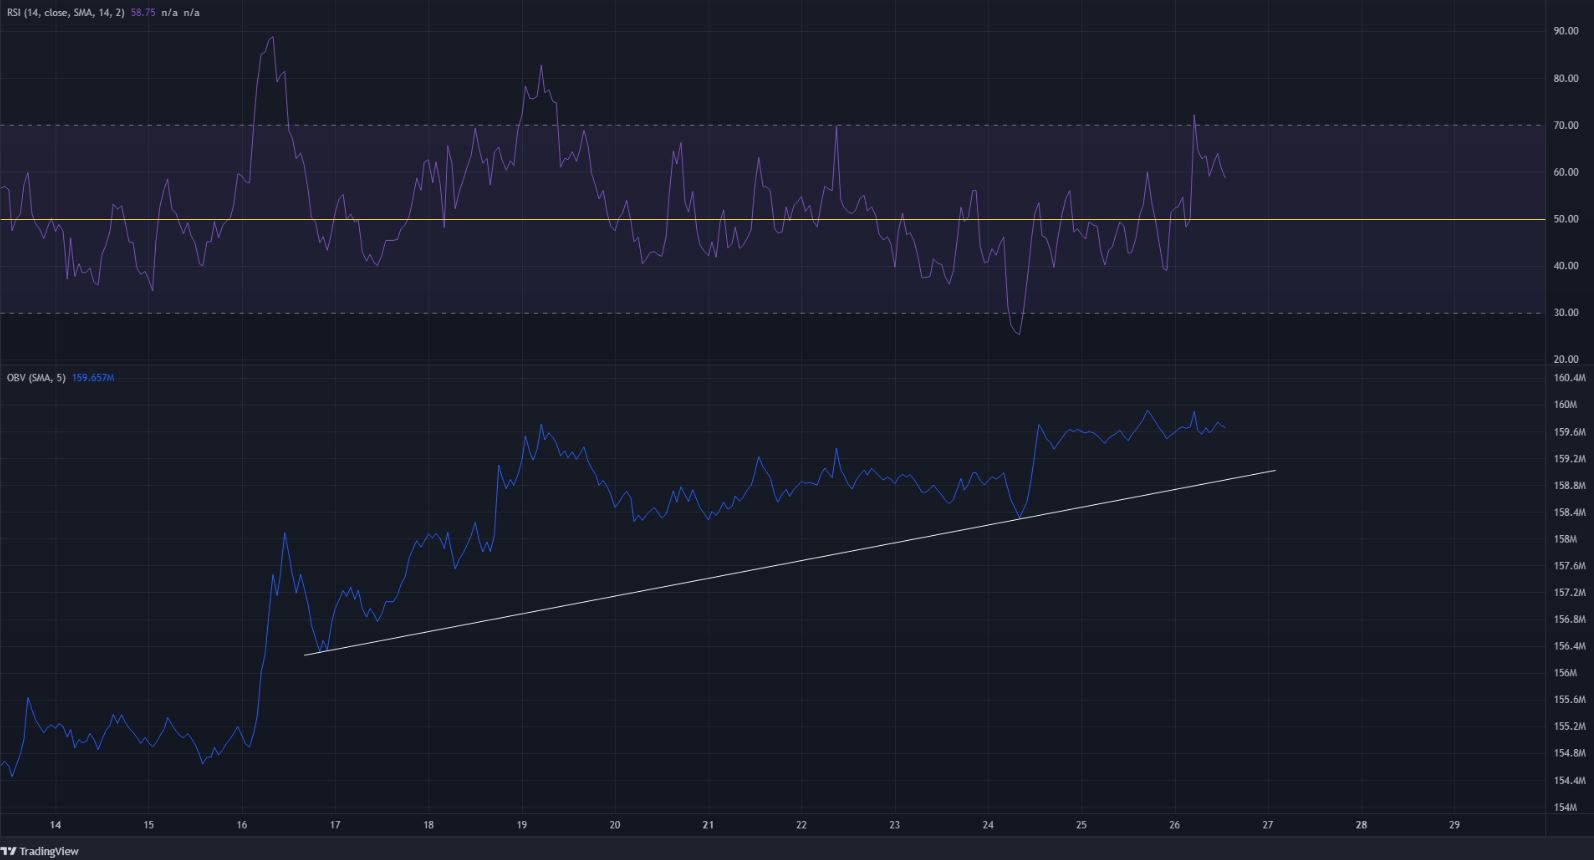
The RSI on the hourly chart had been laboring beneath neutral 50 in the past three days, but pushed decisively past it and stood at 58.75 to show strong bullish momentum. However, the OBV was the more conclusive piece of evidence. The OBV noted that in the past week, despite a pullback in price, the buyers have been bidding steadily and the indicator made a series of higher lows.
Conclusion
The demand (buying volume) shown on the indicators, coupled with the surge back above $32.5, meant that the asset was more likely to be headed higher than see a deep pullback. The $32.5, $31.6, and $30.5 remain strong areas of support to buy WAVES at, in an attempt to catch a wave up to the $35-$37 long-term supply zone.


