How Litecoin can avoid a breakdown from this pattern
After shooting up to an 11-week high of $191.8, Litecoin has slowed down on the charts. A horizontal channel was now in the thick of things as price oscillated between their upper and lower trendlines. From this point, a breakout in either direction was possible but sellers had the edge over proceedings.
To outlast selling pressure, LTC would need to continue defending the lower trendline. This could invigorate a fresh wave of buying pressure to help with a retest of LTC’s 200-SMA (green). At the time of writing, LTC traded at $170.2 with a market cap of $11.59 Billion.
LTC Daily Chart
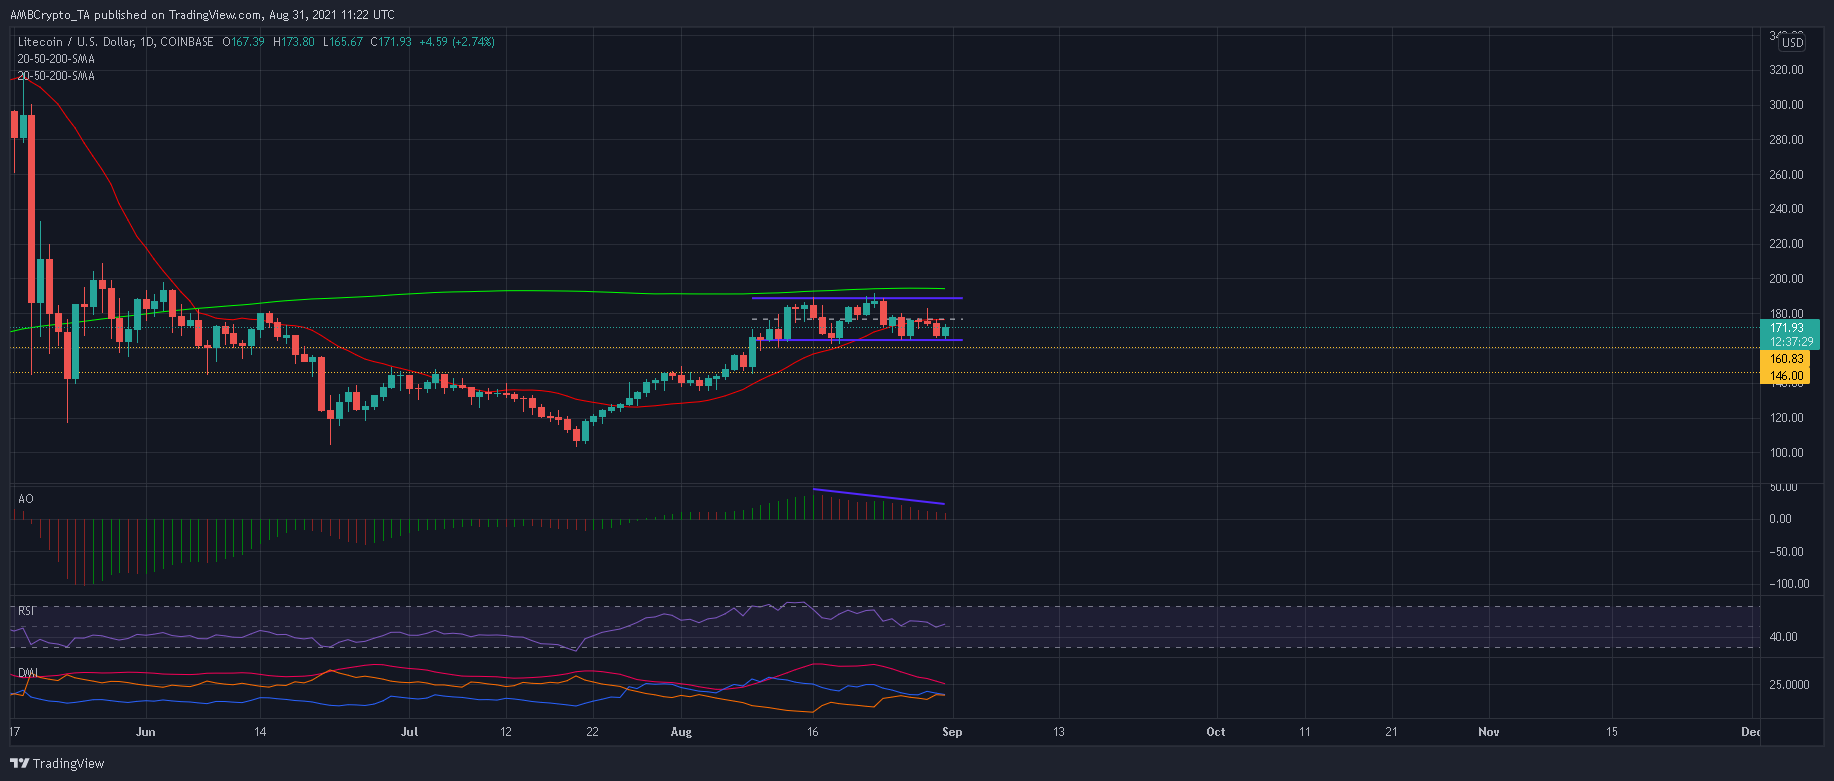
A closer look at the daily chart indicated that sellers have tested the lower trendline on more occasions than the buyers have tested the upper trendline. Over the past few days, buyers have not found the strength to climb above the half-line of the pattern, something which has led to constant drawdowns.
This is why sellers looked more likely to initiate a breakdown from the pattern. A decisive close below the lower trendline and $160-mark would put the market in danger of a further 11% decline in value. Another note was placed around $146, from where the market could bleed further.
To turn back market control, buyers would need to react quickly at the lower trendline and target a close above the 20-SMA (red). From that point, a rise towards the upper trendline can be expected. However, LTC needed to topple its 200-SMA to assert any form of bullish dominance.
Reasoning
The RSI seems to have put up a fight. Buyers have prevented the RSI from declining below 50 and into bearish territory. The Awesome Oscillator also kept above its half-line. However, the AO formed a bearish twin peak setup something which provides a base for sellers to act upon. Meanwhile, sellers have also made progress on the Directional Movement Index. The -DI has slowly inched towards the +DI and eyed a bearish crossover. Such a signal often triggers some selling in the market.
Conclusion
LTC faced an uphill battle in order to avoid a horizontal channel breakdown and an 11% decline loomed large. However, the RSI was yet to fall into bearish control and a green candle highlighted buying resilience. A close eye must be kept on how LTC develops in the coming days. A rise above the 20-SMA (red) could be the building block required to retest the 200-SMA.