

Ethereum: Holder accumulation slows, holders in profit soars – What’s next?
Litecoin
How Litecoin ‘decoupled’ from Bitcoin, Ethereum to hike in last 24 hours
Litecoin was the market’s anomaly as it hiked while other cryptos fell.

- Market sentiment around LTC turned bullish on the charts
- Though a few metrics were bearish, technical indicators supported the market’s bulls
The crypto market at large has been seeing major price corrections lately, with bears dictating the prices of most cryptos. However, Litecoin [LTC] acted differently by pushing its price up in the last 24 hours.
Litecoin surprises investors
CoinMarketCap’s data revealed that top cryptos like Bitcoin [BTC] and Ethereum [ETH]’s daily charts were red. However, Litecoin had other plans. The altcoin hiked by over 3% in the last 24 hours. At the time of writing, LTC was trading at $65.38 with a market capitalization of over $4.89 billion.
Thanks to the aforementioned price hike, LTC’s weighted sentiment went into positive territory. This suggested that bullish sentiment around the token hiked. Additionally, its social volume also remained relatively stable, reflecting LTC’s popularity in the crypto space.
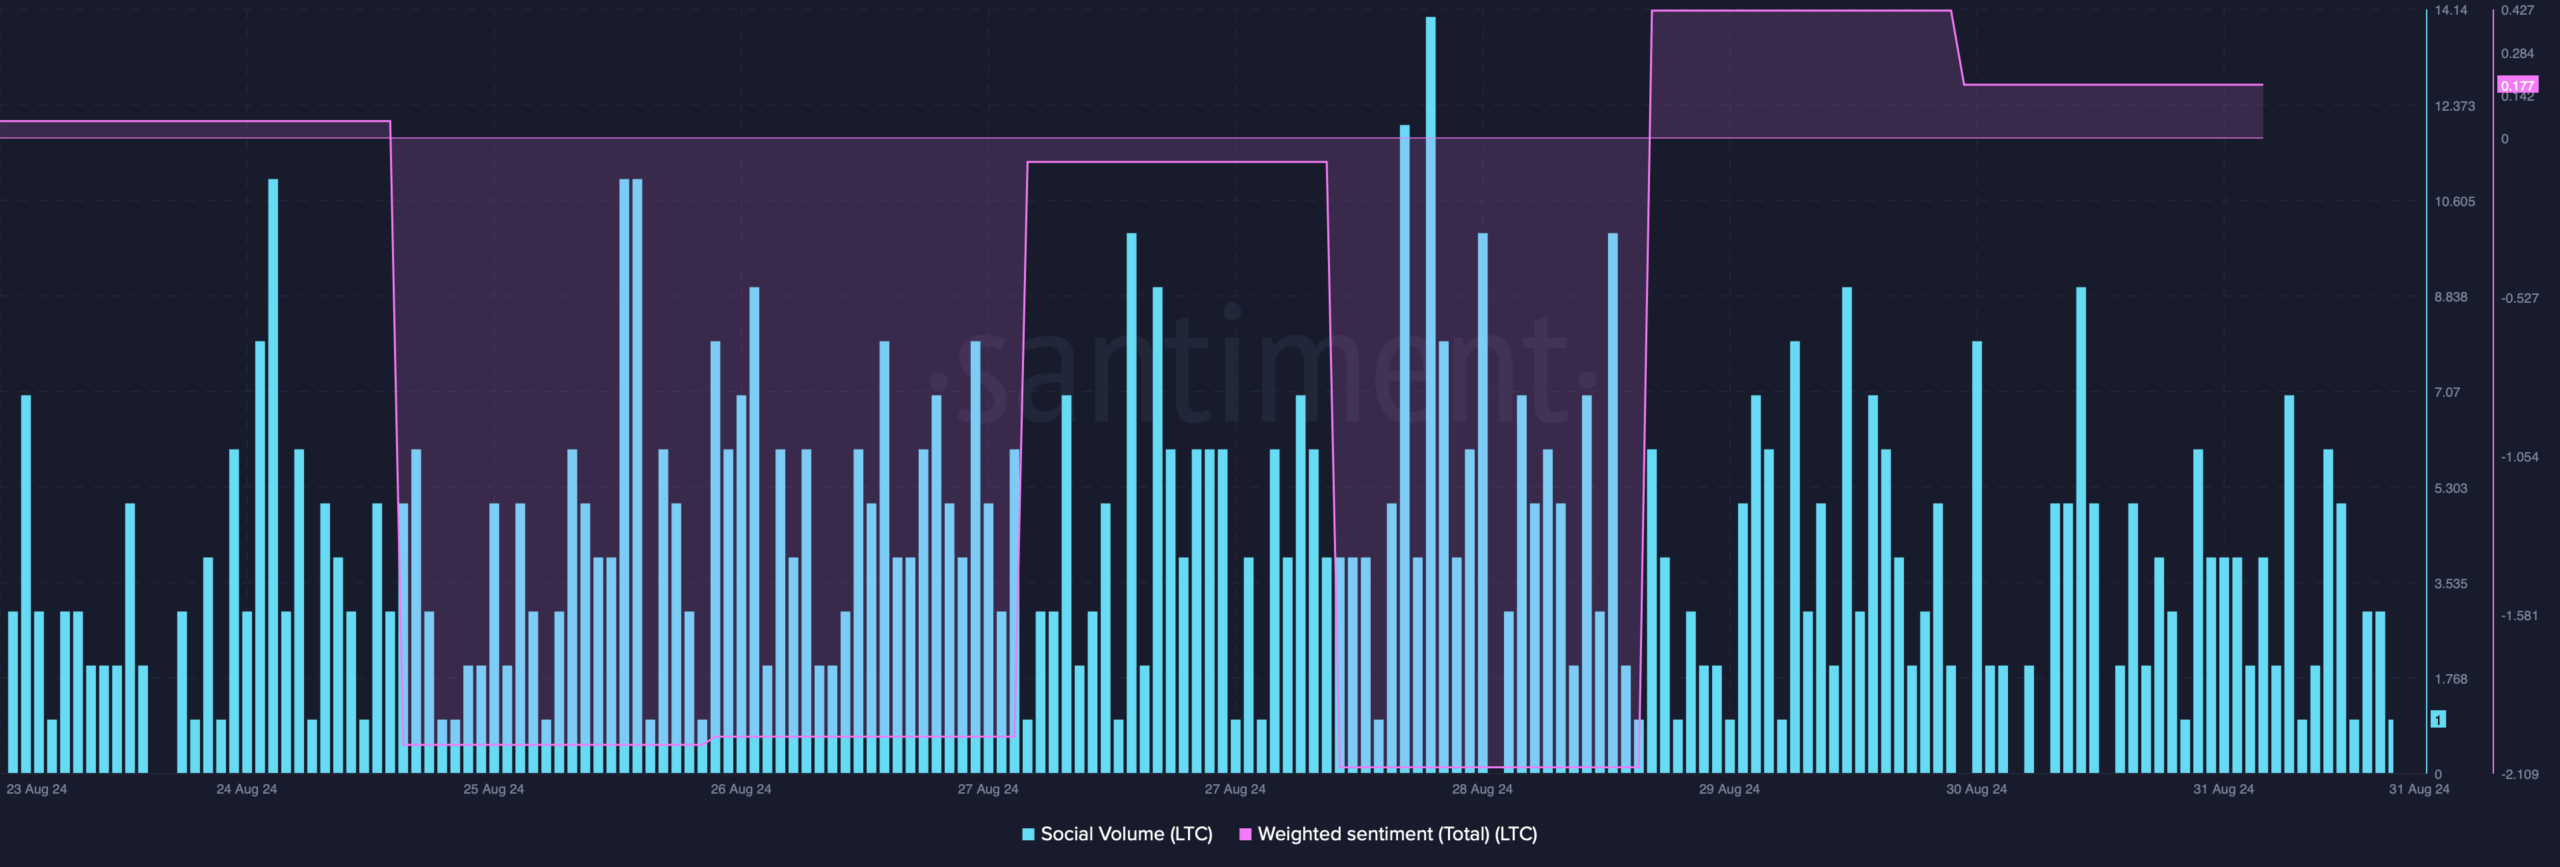
Source: Santiment
AMBCrypto assessed Litecoin’s on-chain data to find out what supported this recent price hike.
As per our analysis of Santiment’s data, LTC’s volume remained high. Usually, a hike in volume along with the price acts as a foundation for a bull rally. Moreover, its MVRV ratio also improved – A bullish feature.
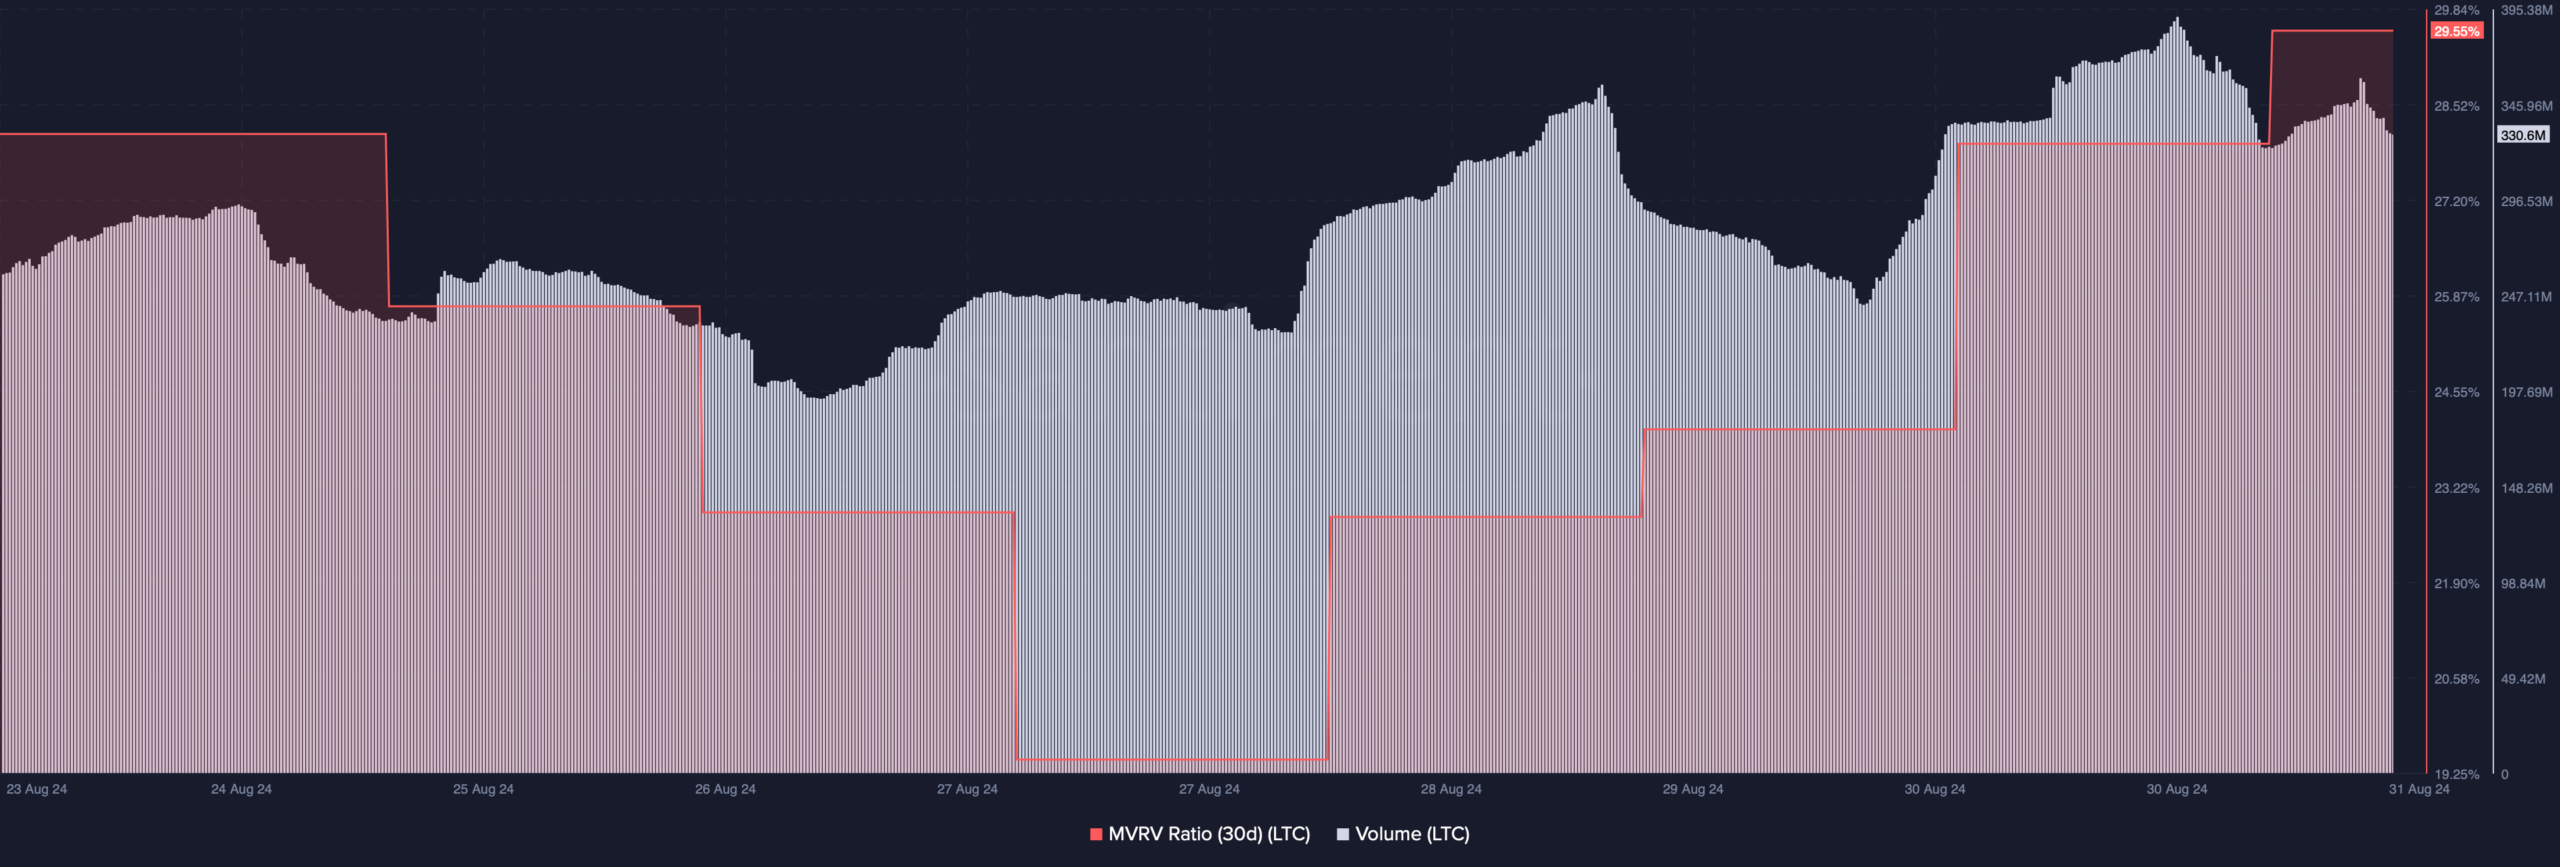
Source: Santiment
Will this trend continue further?
AMBCrypto then checked other datasets to find out the odds of this bull rally continuing.
Our look at Glassnode’s data revealed that LTC is approaching its possible market bottom of $72. If this metric is considered singularly, LTC might continue its journey towards a market top of $148 in the coming weeks or months.
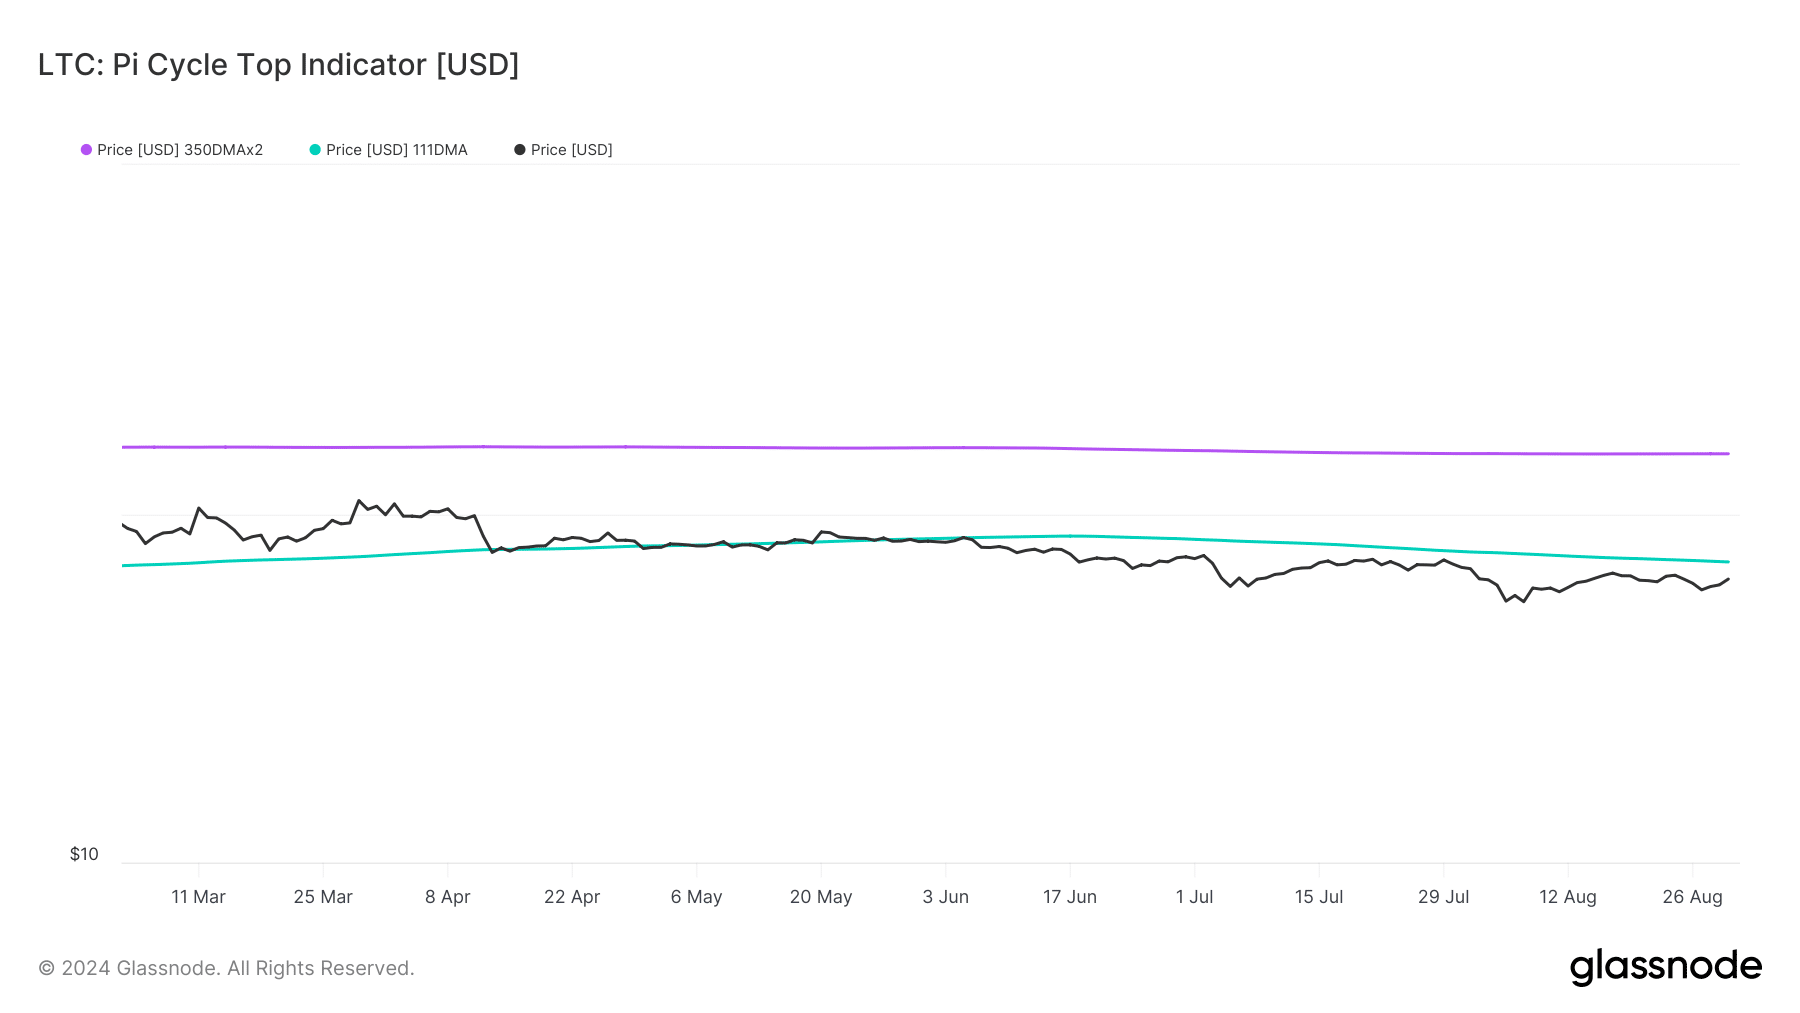
Source: Glassnode
However, everything wasn’t well for Litecoin in the short term.
For instance, its long/short ratio registered a decline. A drop in the metric means that there are more short positions in the market than long positions – A bearish signal.
Additionally, at press time, LTC’s fear and greed index was in a “greed” phase. This suggested that there were chances of LTC seeing a price correction soon.
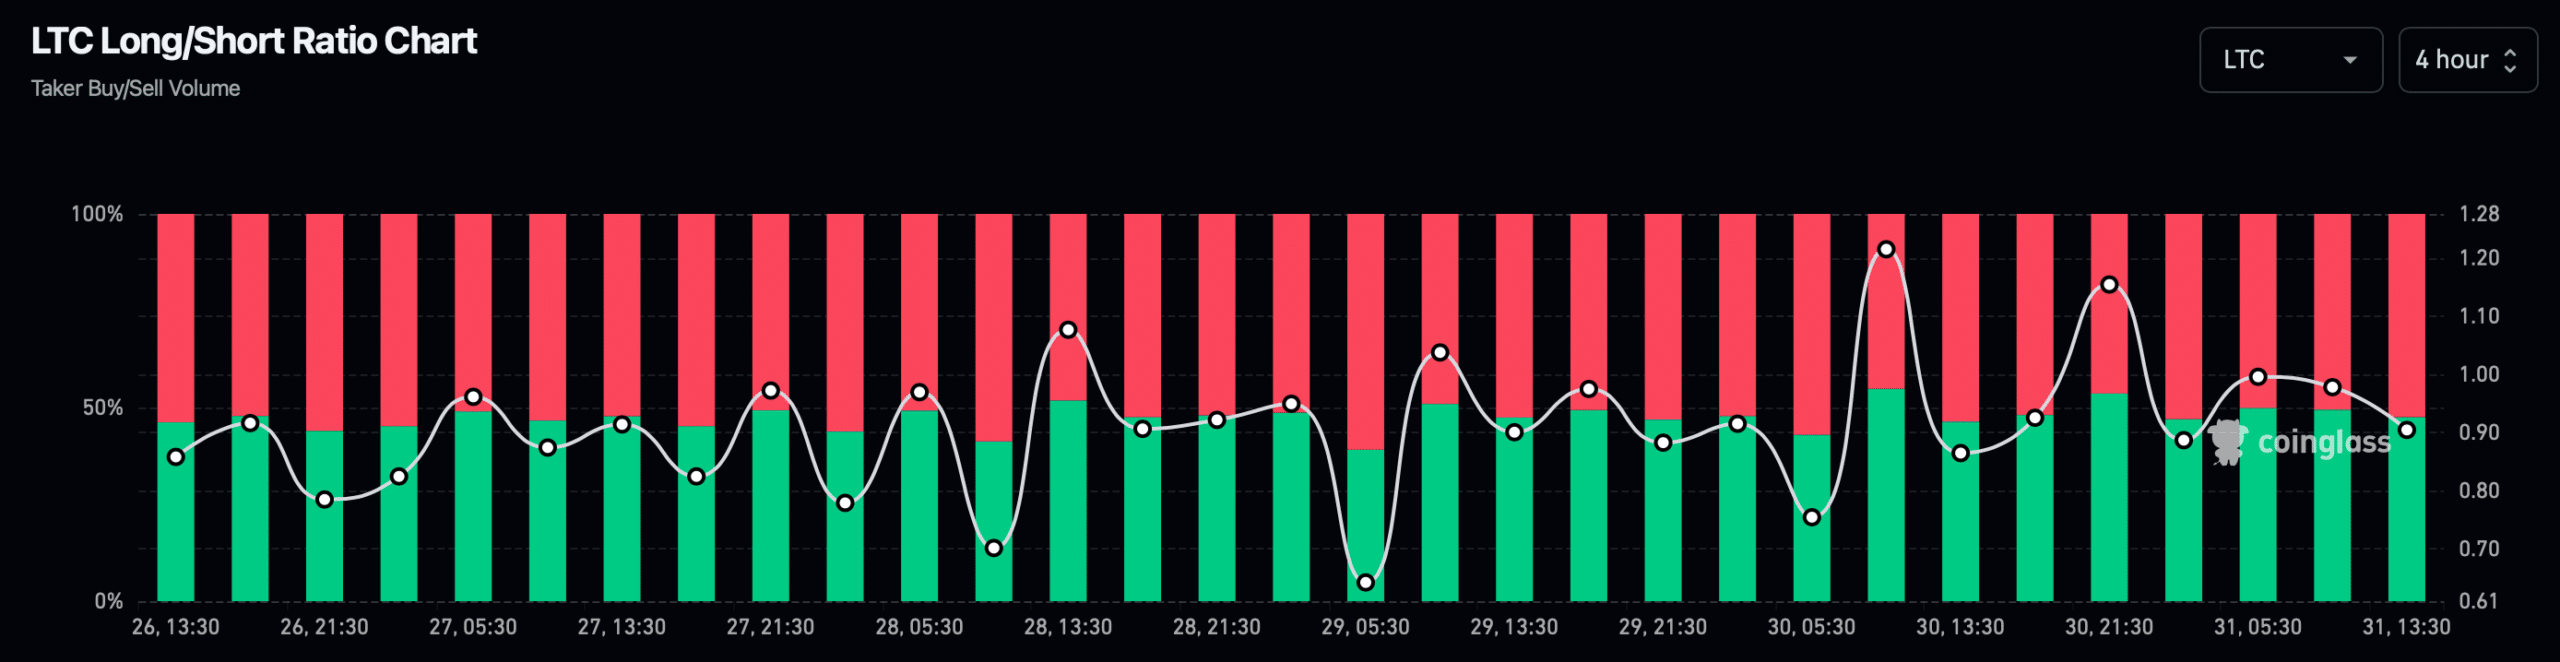
Source: Coinglass
We then took a look at Litecoin’s daily chart to see what technical indicators suggested regarding the bull rally. Though a few of the metrics were bearish, the technical indicators remained bullish. For example, the MACD flashed a bullish crossover on the charts.
Read Litecoin’s [LTC] Price Prediction 2024–2025
Finally, LTC’s Chaikin Money Flow (CMF) registered an uptick. The Relative Strength Index (RSI) also followed a similar increasing trend.
These market indicators, together, suggested that investors might expect LTC’s price to appreciate further.


