Pepe
How PEPE coin rallied to $0.00001725 despite looming resistance
PEPE could be on the verge of the long-anticipated breakout as bullish momentum builds.


- Pepe coin has maintained its upward trajectory, but now faces key resistance ahead.
- Technical indicators point to PEPE overcoming the selling pressure at this critical level, suggesting further gains ahead.
After surging over 57% in the past month, according to CoinMarketCap, Pepe [PEPE] shows no signs of slowing down, with an additional 14% rise in the last 24 hours.
While AMBCrypto forecasts continued upward movement, PEPE must first navigate the immediate resistance to secure further gains.
What traders’ activities indicate
PEPE traded within a symmetrical triangle for months before breaking out on the 26th of September.
This bullish pattern typically signals significant gains, but after the breakout, the token experienced a 30.44% decline in a volatile market.
At the time of writing, PEPE has initiated a fresh rally, making progress to the upside after bouncing off a support region.
However, this momentum is under threat—if it fails to surpass the resistance at $0.00001194, a potential pullback could occur.
Clearing this resistance would set PEPE on course to retest the $0.00001307 level, which is seen as the short-term target.
Sustained buying pressure and momentum could then push the price higher toward $0.00001725.
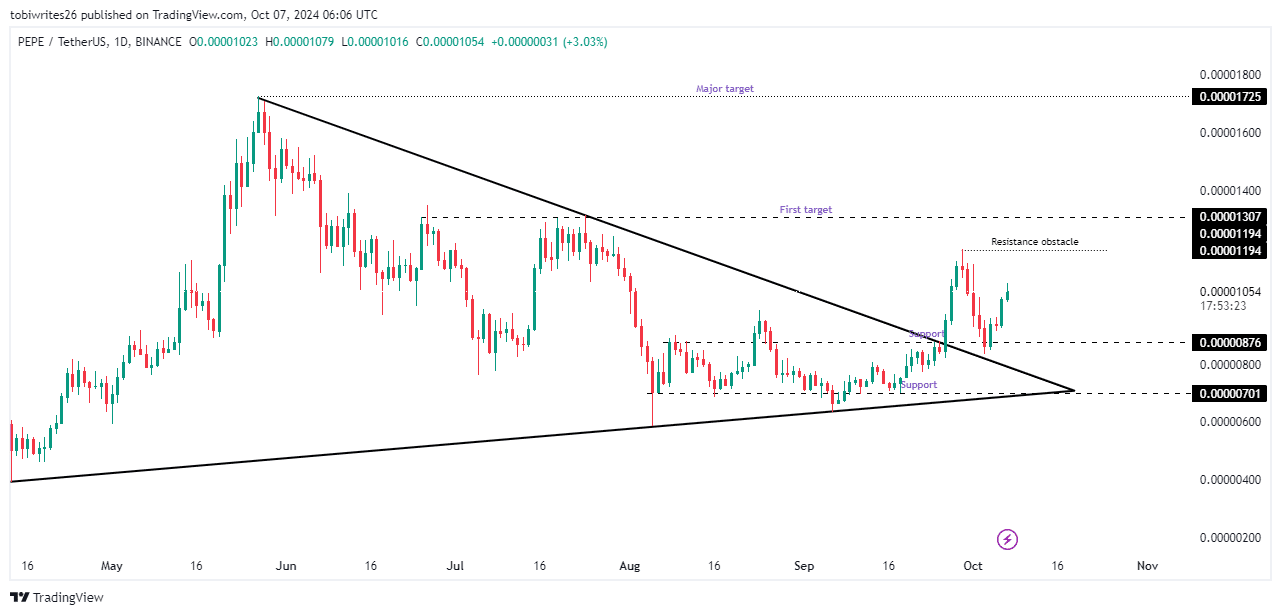
Source: TradingView
AMBCrypto has corroborated these projections, utilizing technical indicators to confirm the market’s likely bullish bias.
PEPE coin’s continued rally
According to technical analysis by AMBCrypto, PEPE is set for further gains, as indicated by the Chaikin Money Flow (CMF) and Relative Strength Index (RSI), both suggesting bullish momentum.
The Chaikin Money Flow measures the inflow and outflow of liquidity in an asset. When in positive territory and trending upward, it signals strong liquidity inflows.
The Relative Strength Index, meanwhile, gauges market sentiment—whether bullish or bearish—by recording changes in the magnitude and speed of price movements.
When RSI trades above 50 and trends upward, it typically indicates the asset’s price will follow a similar direction.
At the time of writing, both CMF and RSI have rebounded from their neutral baselines—0.00 for CMF and 50 for RSI.
With both indicators in positive territory and continuing their upward trends, the likelihood of PEPE extending its rally is strong.
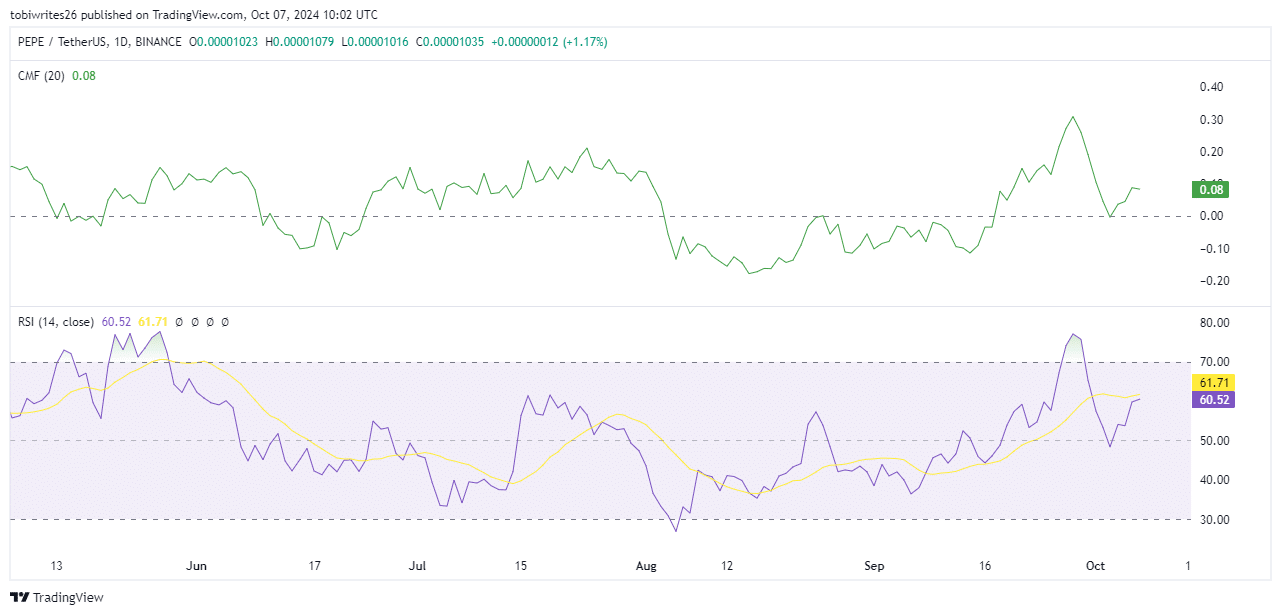
Source: TradingView
PEPE has also formed a golden cross pattern, further reinforcing its bullish outlook. This pattern occurs when the blue MACD line crosses above the orange signal line, typically indicating strong upward momentum.
Following this crossover, PEPE is currently riding this momentum, as reflected by the appearance of a single positive momentum bar on the chart.
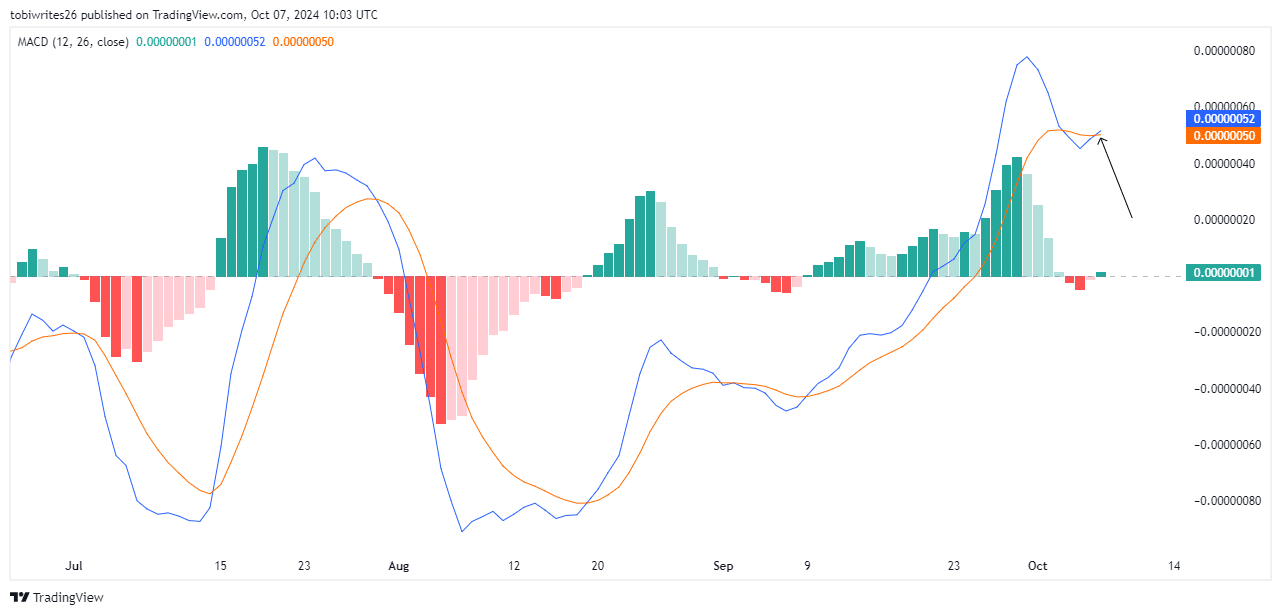
Source: TradingView
This adds further confidence that PEPE coin could surpass the $0.00001194 resistance level, opening the door for additional gains.
Traders’ interest remains strong
Open Interest, which measures the number of unsettled derivative contracts for an asset, has shown a positive increase, with a 15.10% gain pushing it to $162 million.
Read Pepe’s [PEPE] Price Prediction 2024–2025
This rise in Open Interest suggests that more long traders are entering the market, either opening new contracts or adding to existing positions, in anticipation of continued upward price movement.
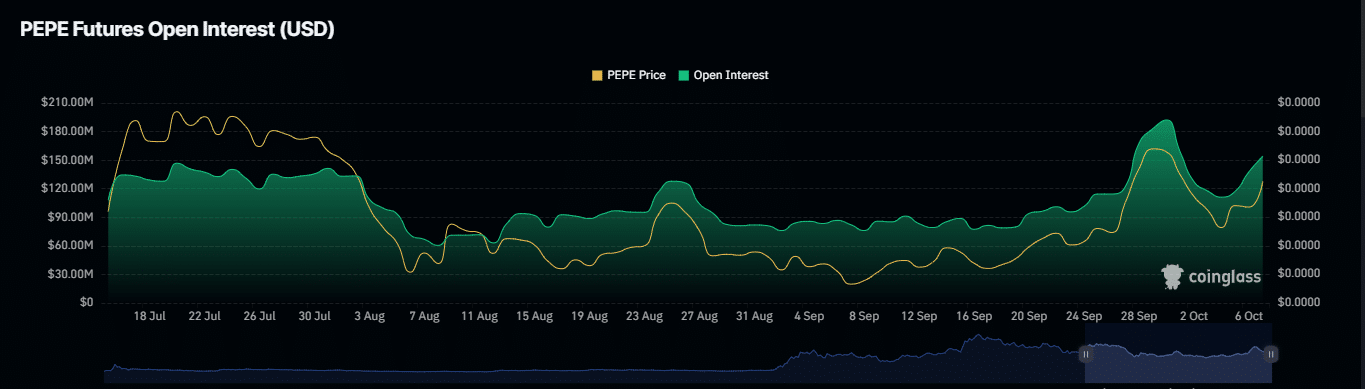
Source: Coinglass
If this trend persists alongside other supporting technical indicators, PEPE is on track to reach the projected price targets.