How PEPE traders can profit from this near-term volatility

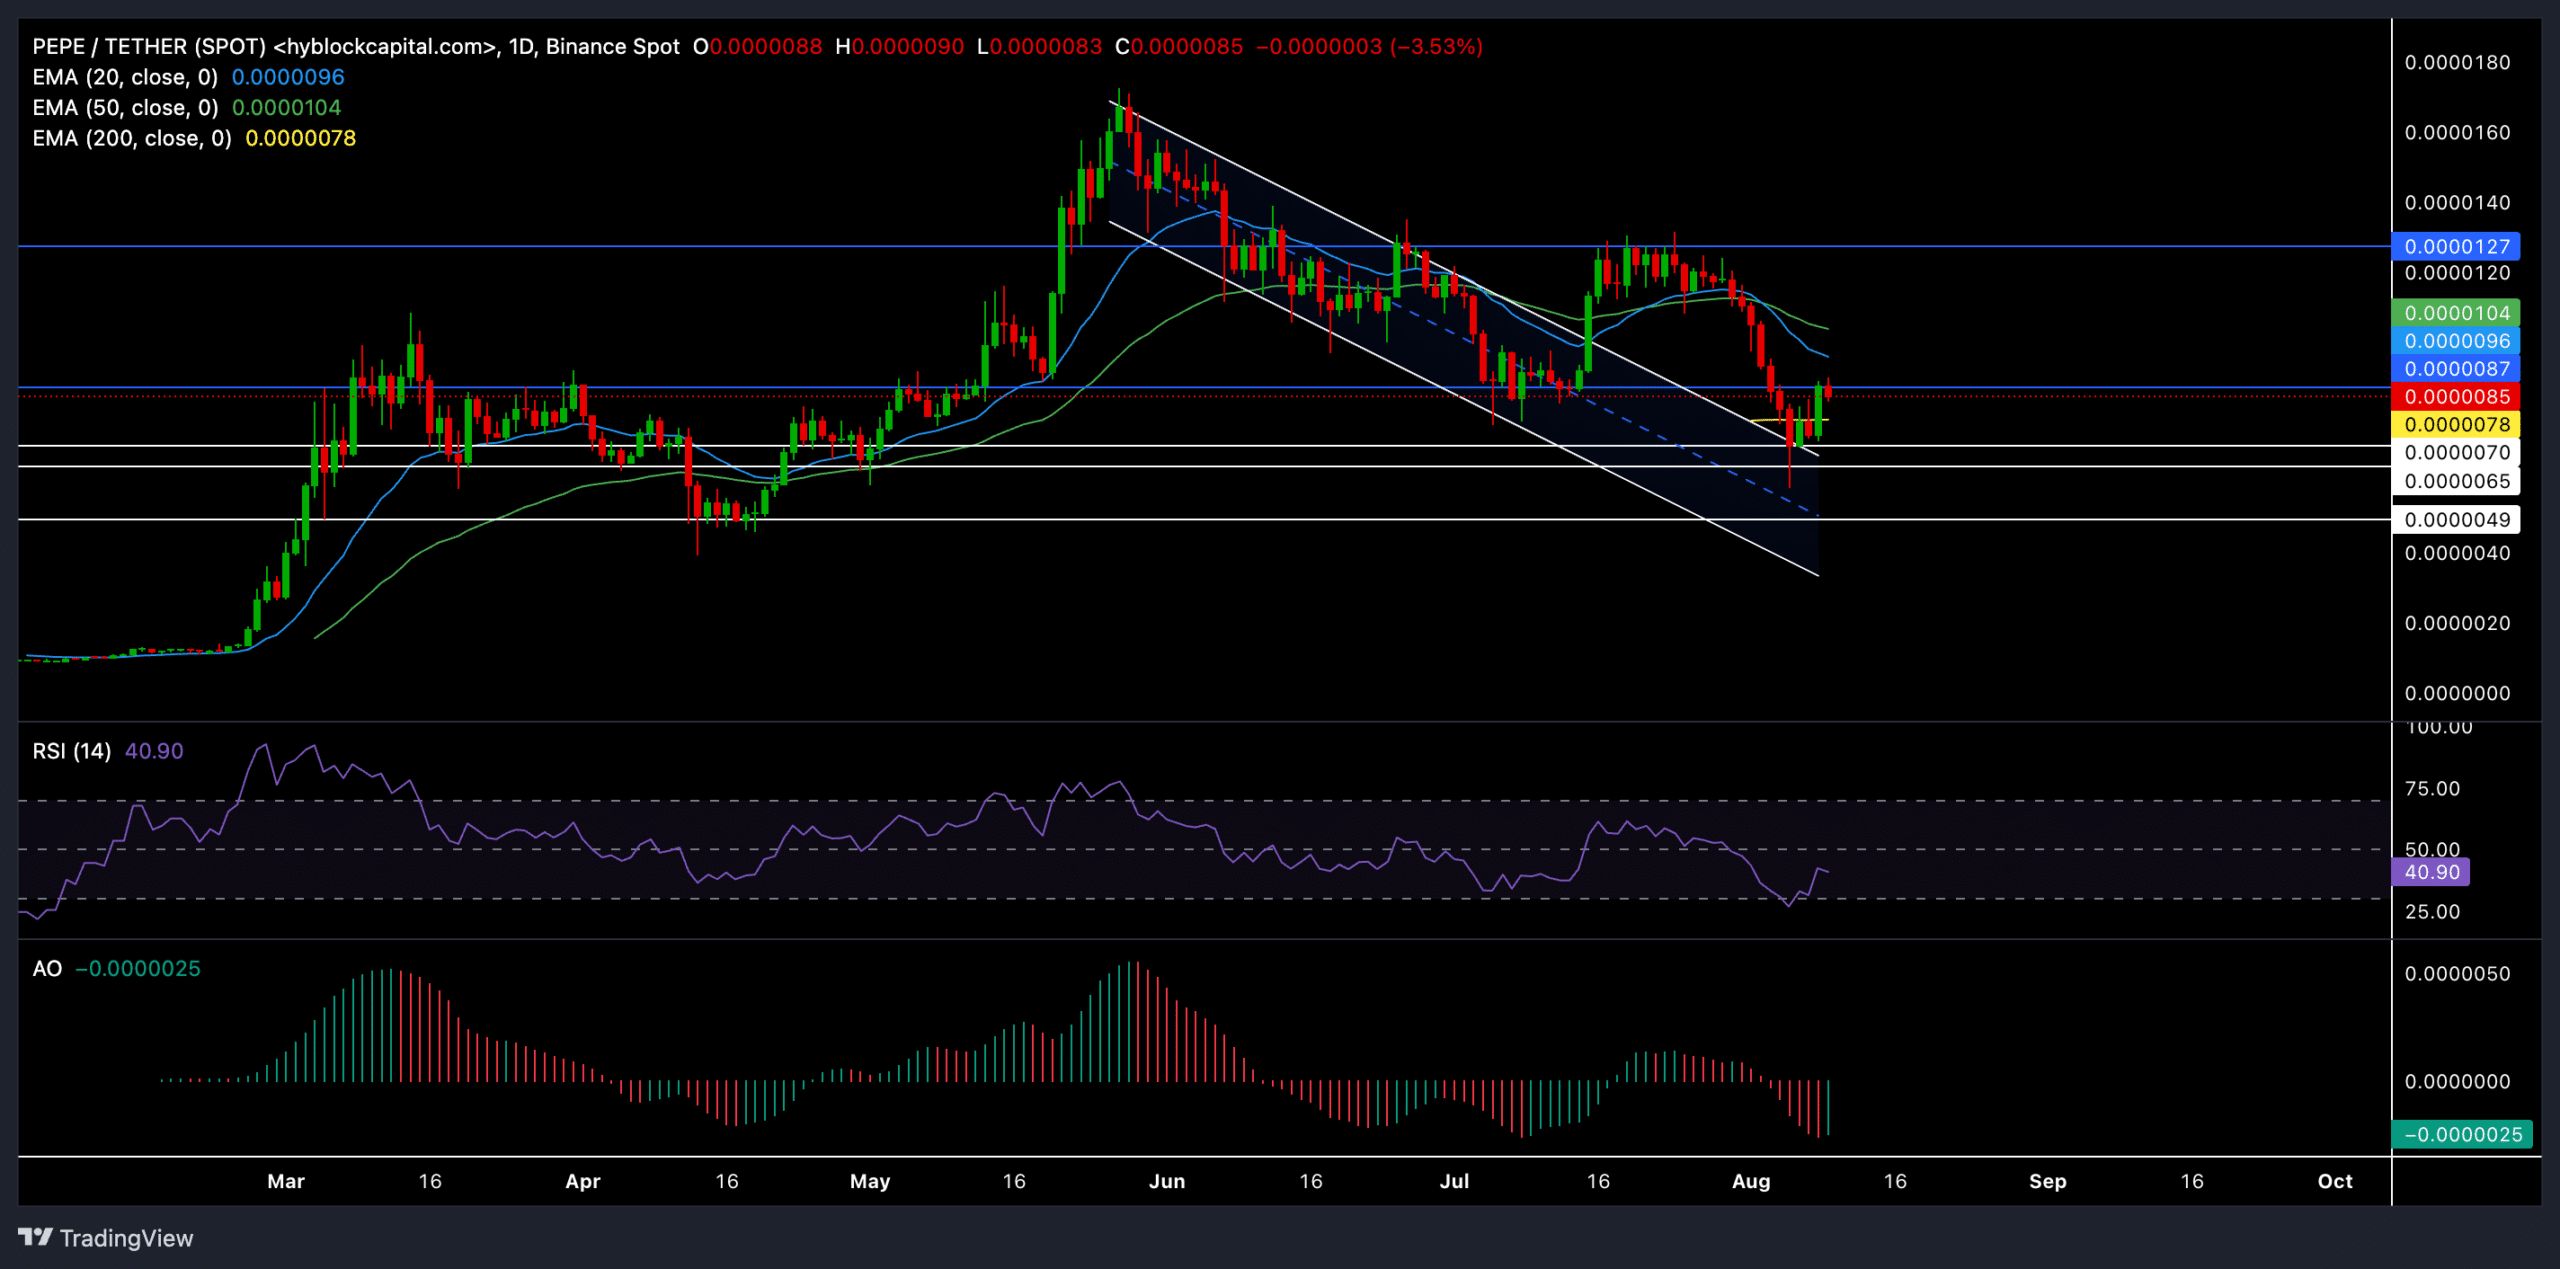
- PEPE’s bearish trend continued as it fell below the 20-day and 50-day EMAs, but near-term volatility could offer some opportunities
- Memecoin’s derivates data revealed cautious optimism for buyers
The memecoin market’s sentiment improved as its total market cap surged by 10% to over $42 billion over the past 24 hours. Additionally, the Crypto Fear & Greed Index showed a ‘neutral’ reading after hovering in the fear zone for a long time.
PEPE lost all its near-term bullish edge after it recently declined below its 20-day and 50-day EMAs after reversing from the $0.0000127 resistance. However, the recent rebound from the memecoin’s immediate support level has set the stage for buyers to re-enter the market.
PEPE was trading at $0.0000086, at the time of writing.
Can PEPE bulls reverse the near-term trend?
PEPE had entered a relatively long-term bearish trend, as the price action kept marking lower highs and lows while losing crucial support levels.
In the meantime, PEPE formed a descending channel pattern on its daily chart, depicting a relatively high bearish edge, and fell below its 20-day and 50-day EMAs.
Here, it’s worth noting that PEPE recently saw an expected breakout from its descending channel, one that helped the buyers retest the $0.0000127 resistance in mid-July.
However, the bears stepped in to provoke a steep downtrend from this resistance level amid market uncertainty. This downtrend has now found support at the confluence of the horizontal and diagonal support levels near the $0.0000065 – $0.000007.
The buyers would now aim to provoke a near-term uptrend. Alas, the $0.0000087 resistance could pose near-term hurdles. Should PEPE find a close above this level, bulls would aim to retest the $0.0000127 in the coming sessions.
On the other hand, if the broader market sentiment continues to deteriorate, the memecoin could test the next major support level at $0.0000049.
The Relative Strength Index (RSI) continued to show a bearish edge but was on an uptrend after dipping into the oversold zone. A likely close above the 50-level can affirm the ease of selling pressure.
Also, the Awesome Oscillator finally showed a green line after PEPE’s recent gains – An early indicator of a bullish edge.
Derivates data revealed THIS
The hike in Open Interest over the last 24 hours suggested more traders have been entering the market, possibly anticipating further price movements in PEPE.
While there’s a near-balance between long and short positions, the slight lean towards shorts (with a long/short ratio of 0.9736) may be a sign of cautious optimism. However, the significant liquidations, especially on the short side, highlighted volatility and the potential for further price action.


![Chainlink [LINK] price prediction - Watch out for a defense of THIS key level!](https://ambcrypto.com/wp-content/uploads/2025/04/Evans-17-min-400x240.png)


