How ‘quick’ might a ‘quick’ move for SAND be

Sandbox’s price registered gains of 1.75% over the last 24 hours, showing signs of heading higher after setting up a bullish reversal pattern on 21 February. In fact, on-chain metrics seemed to indicate that the uptrend is likely to continue on the charts.
A perfect concoction of bullishness
SAND’s price was rangebound and showed no evident signs of moving higher, at least from a technical perspective. However, due to the consolidatory nature of the price action, there is a good chance of a volatile move. Even so, such an indication would lack any directional bias.
On-chain metrics, on the other hand, underlined a much more nuanced outlook for Sandbox. According to the same, the bullish outlook is not a question of ‘if’ but ‘when.’
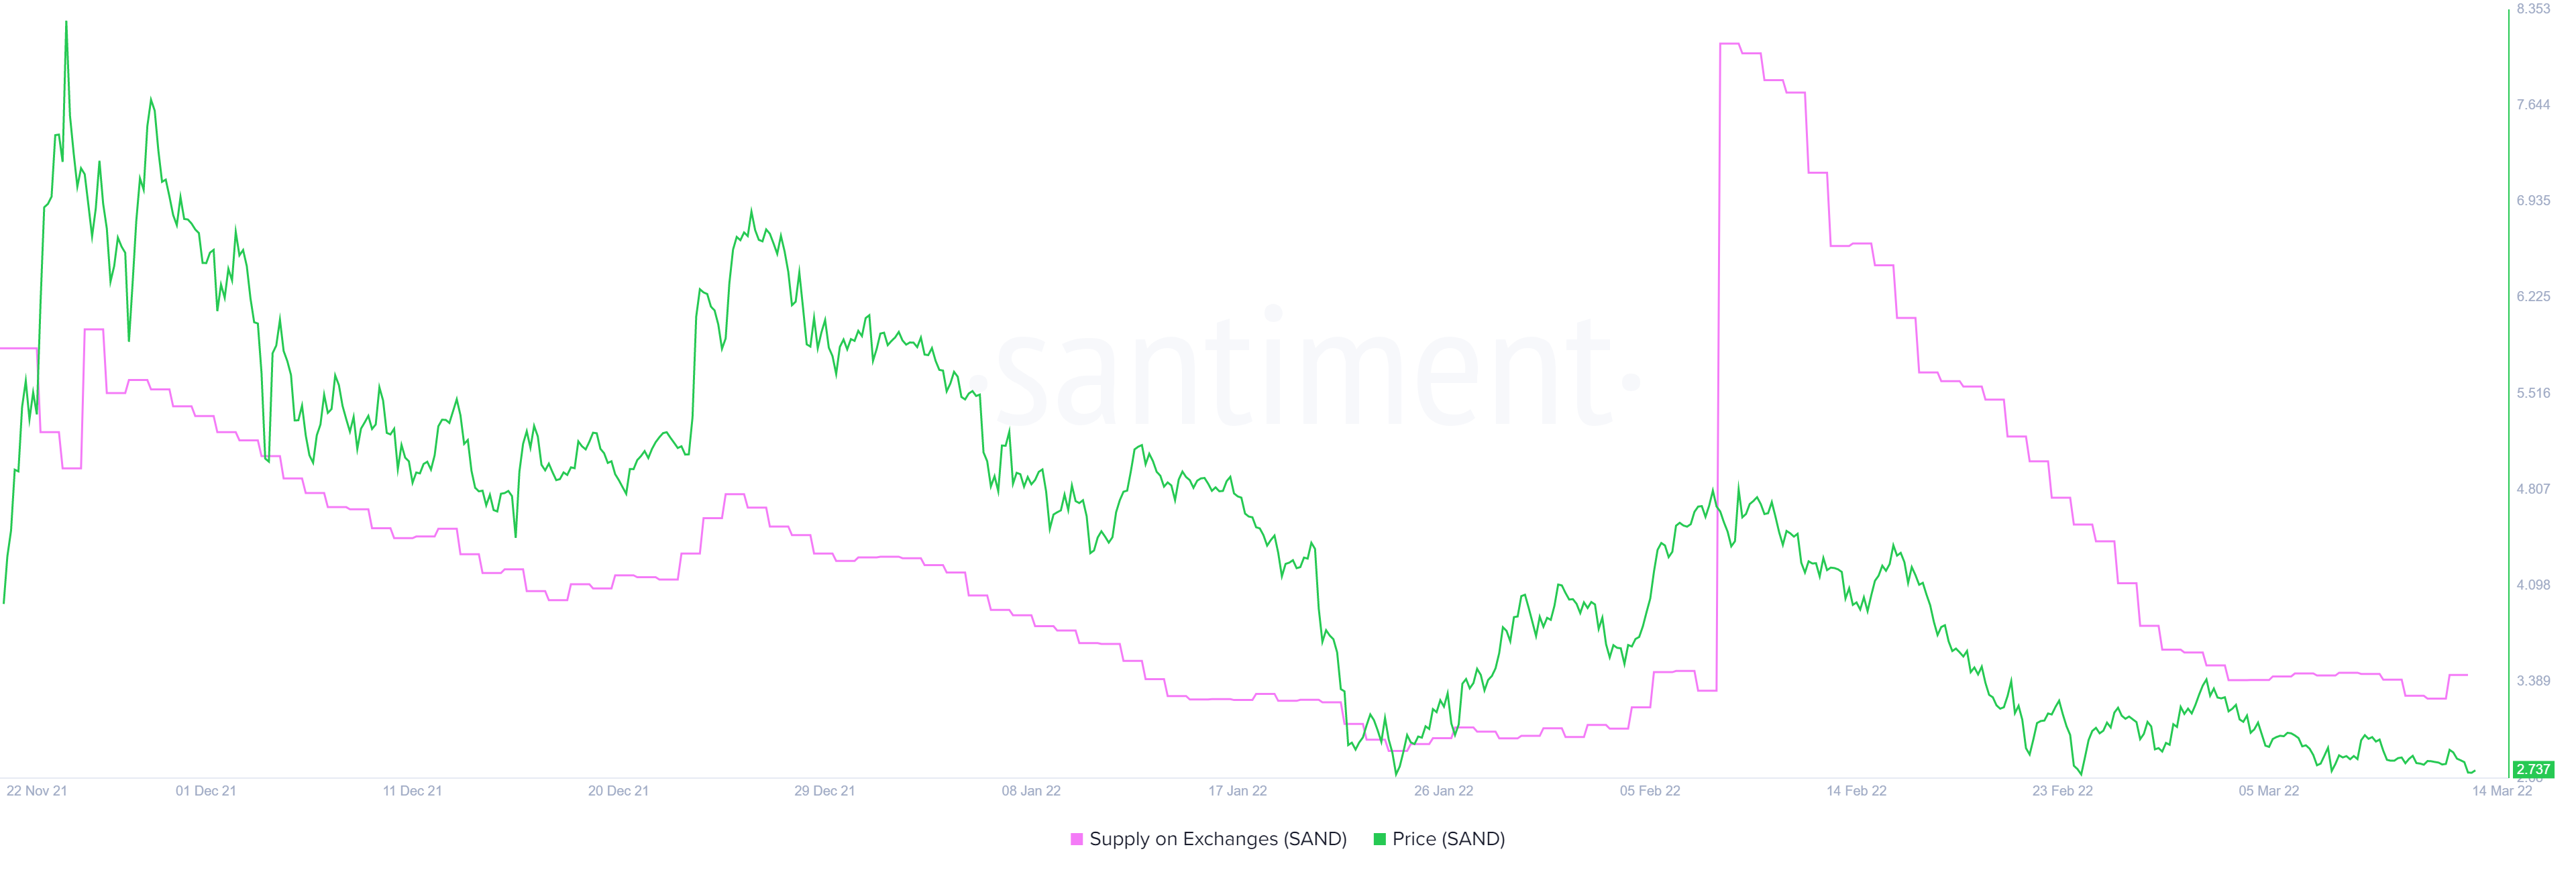
The supply on exchanges is an important metric since it helps determine potential sell-side pressure, a part of it, if not the whole picture. In Sandbox’s case, if the number of SAND tokens held on centralized entities increases, it indicates investors’ uncertainty. During a flash crash, these holders are likely to panic sell their holdings, adding more pressure and steepening the nosedive.
On 8 February, the number of SAND spiked from 441 million to 542 million, indicating an inflow of roughly 100 million tokens. Since then, SAND’s price has crashed from $4.8 to $2.7, denoting a 43% crash and further signifying the importance of this metric.
What more should you know
However, this spike in tokens held on exchanges later dropped back to the pre-spike days. This is a sign that there isn’t a lot of sell-side pressure. This development also reveals that the bulls may just be ready for a takeover.
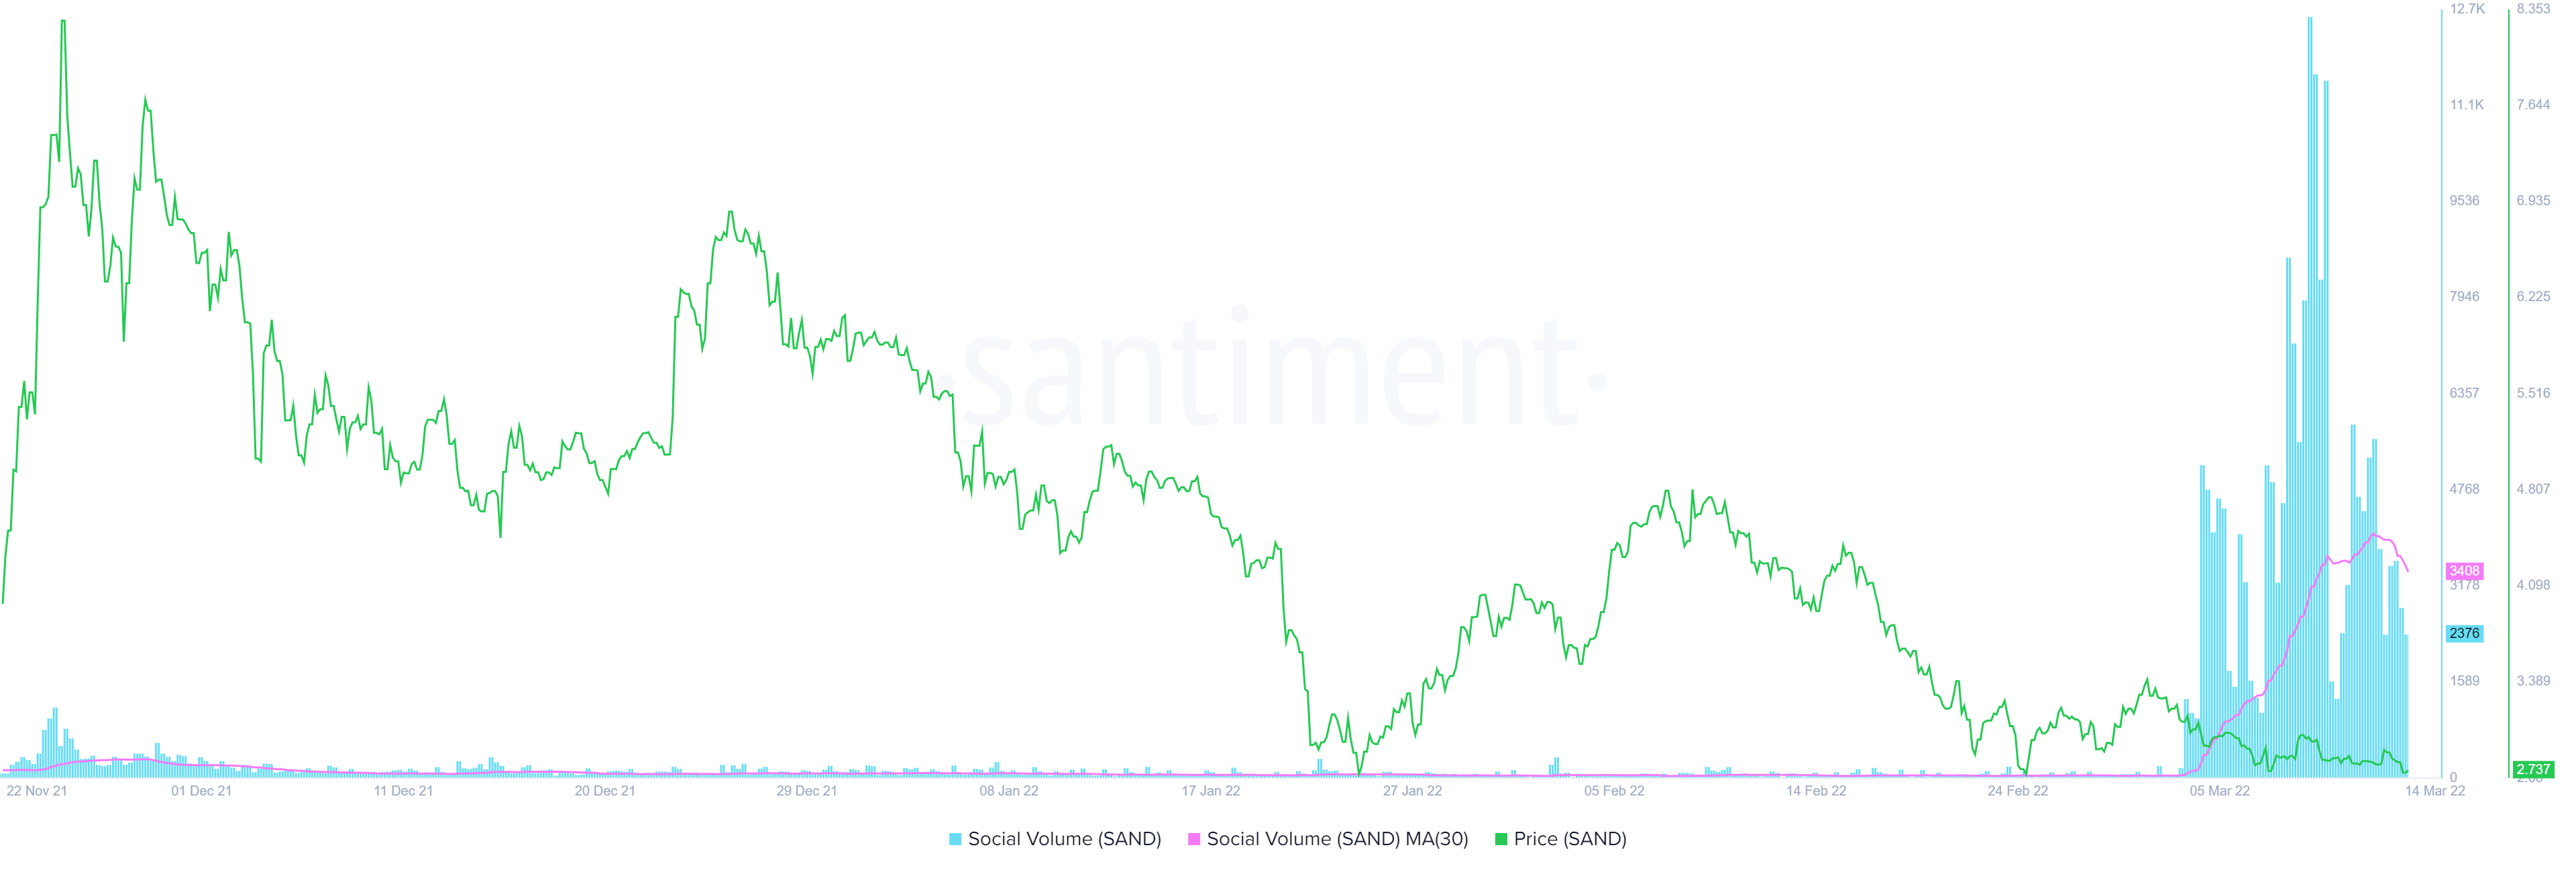
Further supporting this thesis is the recent spike in social volume for Sandbox to 11,642 – A new all-time high. This spike also suggested that retail investors are interested in SAND at the current price level.
During slumps, this uptick could serve as a bottom signal with the contrary of this being true as well.
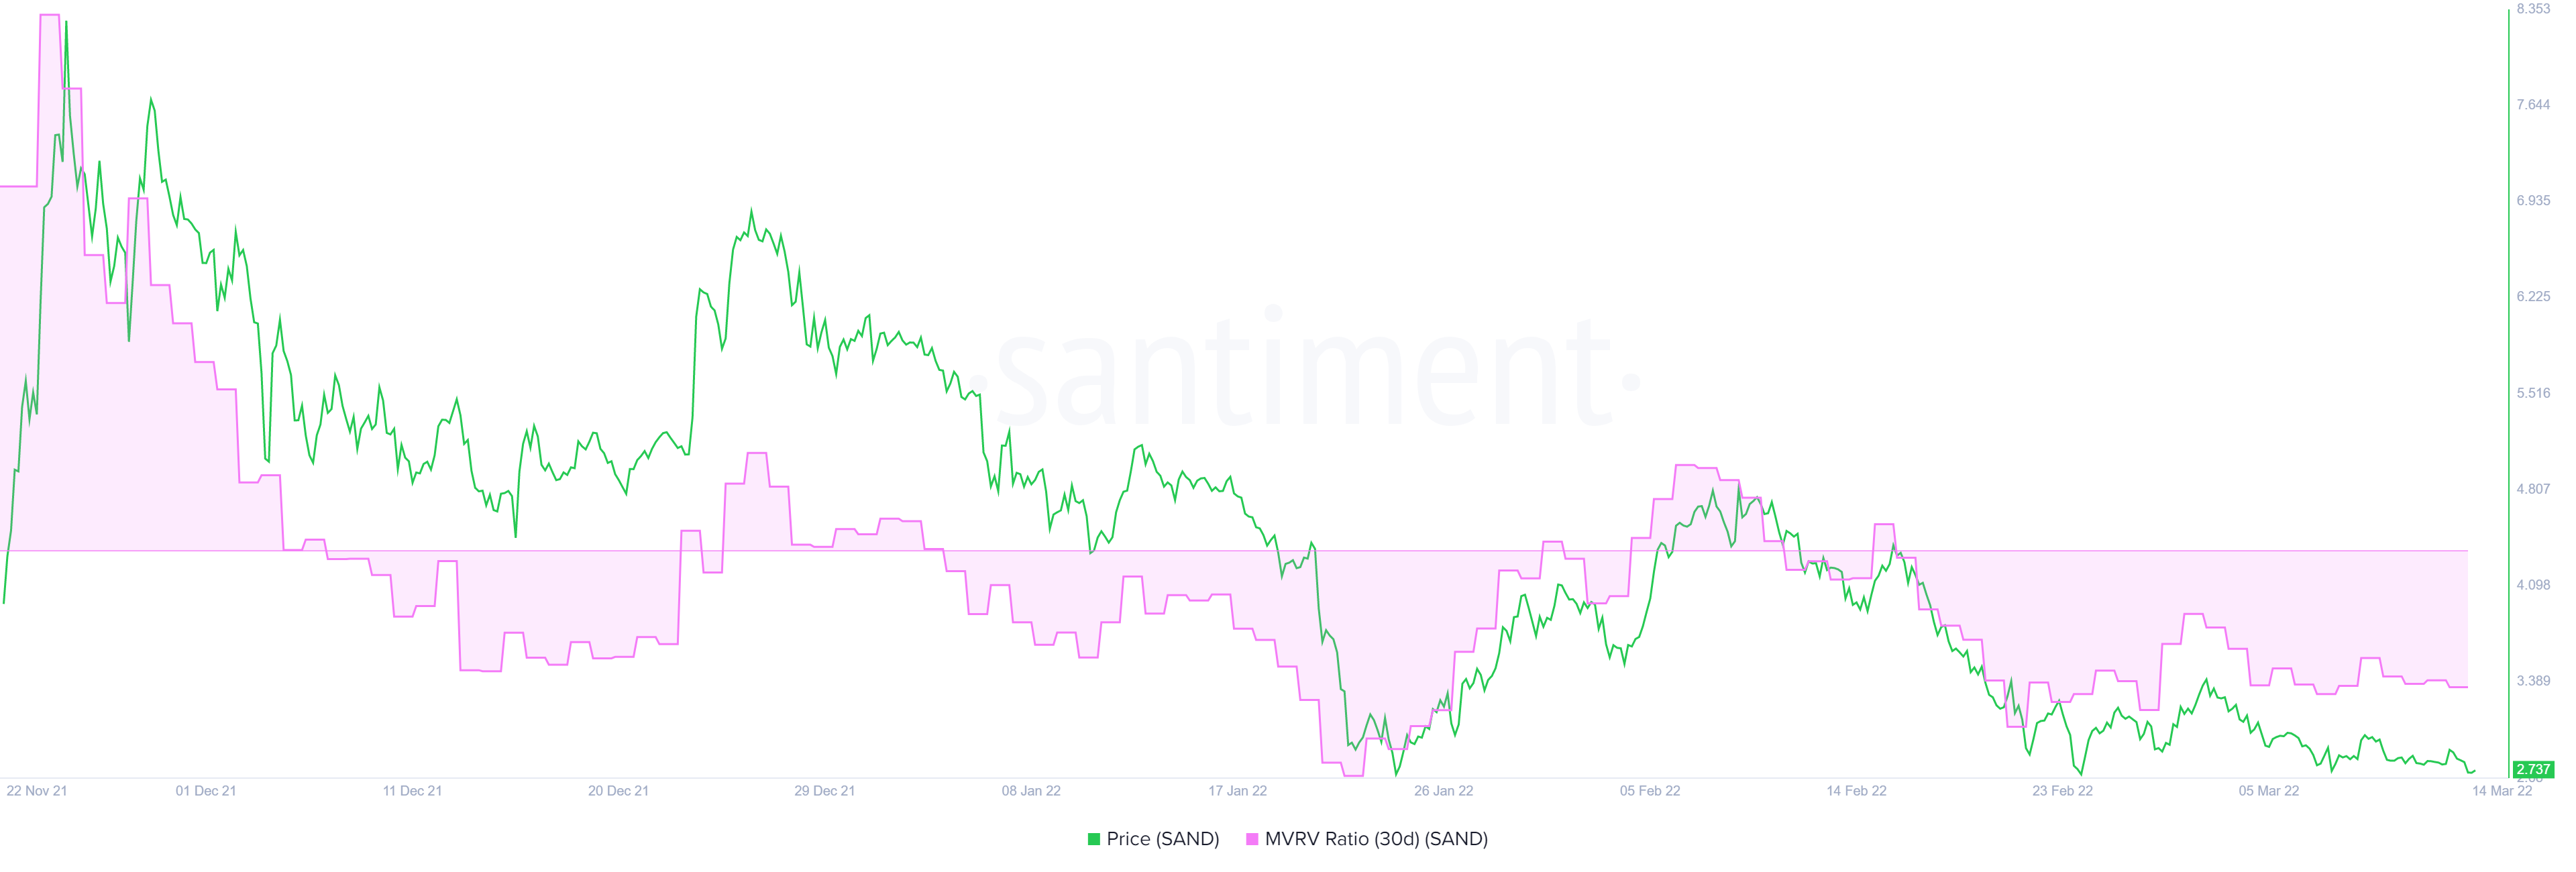
The Market Value to Realized Value (MVRV) model seals the deal for the bullish thesis as it has been hovering around 20% since 20 February. This indicator is used to assess the average profit/loss of investors who purchased SAND tokens over the past year.
A negative value below 10% indicates that short-term holders are at a loss and is typically where long-term holders tend to accumulate. Therefore, a value below -10% is often referred to as an “opportunity zone.”
So, investors can expect long-term buyers to swoop in and accumulate SAND at a discount, kick-starting an uptrend.
Combing the three on-chain metrics reveal a perfect concoction for the bullish outlook that is set to take over Sandbox.