How Solana traders can capitalize on this buy opportunity

Disclaimer: The findings of the following analysis are the sole opinions of the writer and should not be taken as investment advice
While the broader crypto-market has mostly remained flat over the past week, Solana has been pumping to the moon. With weekly gains of 52%, the DeFi platform’s native cryptocurrency, SOL, has skyrocketed into the top-10.
On the charts, the alt has continued its upwards run on the back of a bull flag breakout that peaked at $130. However, a correctional phase seemed to be in effect, at press time, and SOL needs to steady ship before its next upcycle.
At the time of writing, SOL was trading at $108.46, down by 8% over the last 24 hours.
Solana 4-hour Chart
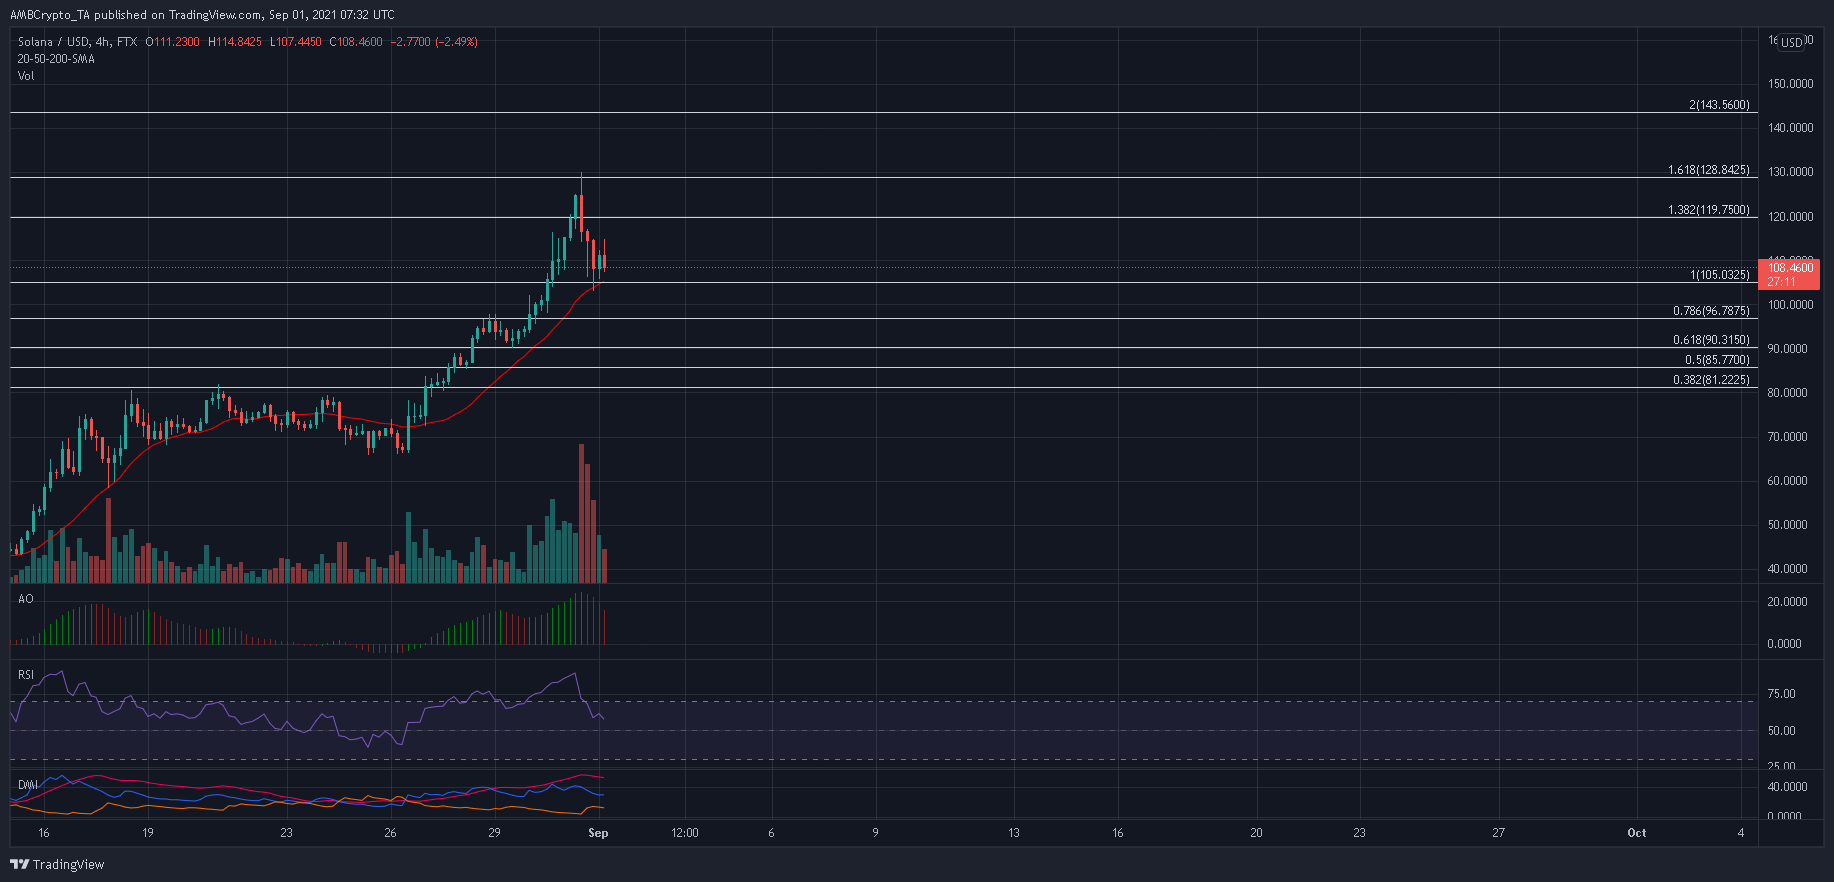
SOL’s impulsive move from $43 to a swing high of $82 and a correction to $66 thereafter were used to plot out a few important Fibonacci Extension levels. The 100% Extension level, backed by the 20-SMA, has the potential to kickstart another round of buying pressure.
A deeper retracement would bring focus to the 61.8% level. A level that has already served as a base for buying activity. On the other hand, any move towards the 50% and 38.2% levels would invite short-selling.
The next target for SOL lay at the 200% Extension present at $143.56. However, before such a move, SOL needs to negotiate with selling pressure. A few tall red bars lined up on its chart and identified heavy profit-taking over the past couple of sessions. Buyers would need to be vigilant from here to avoid a drop below the 61.8% Fib level.
Reasoning
Each of SOL’s indicators factored in the strong wave of selling pressure. Even so, it still traded above key areas. For instance, the RSI witnessed a sharp drop from the overbought zone and was heading towards the half-line. Nevertheless, traders need not fear a sharper pullback till the RSI maintains itself above 45-40.
Even the Awesome Oscillator registered four red bars after forming its highest ever peak. On the Directional Movement Index, the -DI was inching closer to the +DI line as a result of selling pressure. However, a crossover had not developed just yet.
Considering the aforementioned signals, SOL has the advantage to continue its upwards run as long as the indicators remain in favorable positions. Failing to do so would pave the way for an extended sell-off.
Conclusion
Since SOL is looking to stabilize its current losses, traders have the opportunity to bag the alt before its next upcycle. The 100% Extension level would be an ideal entry for bullish traders, especially since the region is backed by the 20-SMA.
Take-profit can be set at the 200% Fibonacci Extension level of $143.56. On the other hand, short-sellers need SOL to decisively close below its 20-SMA to take advantage of the situation.