
Polygon’s liquidity strain: Can POL’s support hold as selling rises?
- Solana’s price appreciated by more than 22% in the last seven days
- Most metrics were bullish, but market sentiment remained bearish
Solana [SOL] bulls have well controlled the market over the past month as the token’s price charts remained green at press time. A further surge might be triggered by a bullish breakout though, especially if SOL continues to test the pattern. Hence, it’s worth looking at that scenario.
Solana is holding strong
According to CoinMarketCap, Solana’s price hiked by more than 22% in the last seven days. In the last 24 hours alone, the token’s price surged by over 5%. At the time of writing, SOL was trading at $169.98 with a market capitalization of over $78.9 billion.
Recently, World Of Charts’ data pointed out a development that might have helped SOL gain value over the past few weeks. According to the same, a bullish pennant pattern emerged on the token’s price chart, and SOL has been consolidating inside it since March.
At press time, SOL was on the verge of a breakout. If that happens, then the altcoin might begin a bull rally towards $300 in the coming weeks.

Source: X
That’s not all though as Santiment also shared a tweet highlighting an interesting development.
The on-chain analytics platform found that Solana’s faithful have been rewarded for their patience as the alt’s price has broken out by +33% since 4 July. The tweet mentioned,
“The climb is being fueled by crowd doubt toward SOL. Until FOMO replaces the FUD, $200 SOL is very much reachable soon.”
Will SOL hit $200 soon?
AMBCrypto then took a look at the token’s on-chain data to see whether a rally towards $200 is likely to happen.
Our look at Coinglass’ data revealed that SOL’s long/short ratio increased sharply on the charts. A hike in the metric means that there were more long positions in the market than short positions – A bullish sign.

Source: Coinglass
Solana’s trading volume also climbed last week while its price surged. Whenever trading volume rises along with price, it acts as a foundation for the ongoing bull rally, hinting at a sustained price hike.
Nonetheless, it was surprising to see that SOL’s weighted sentiment remained in the negative zone, suggesting that bearish sentiment was dominant in the market.
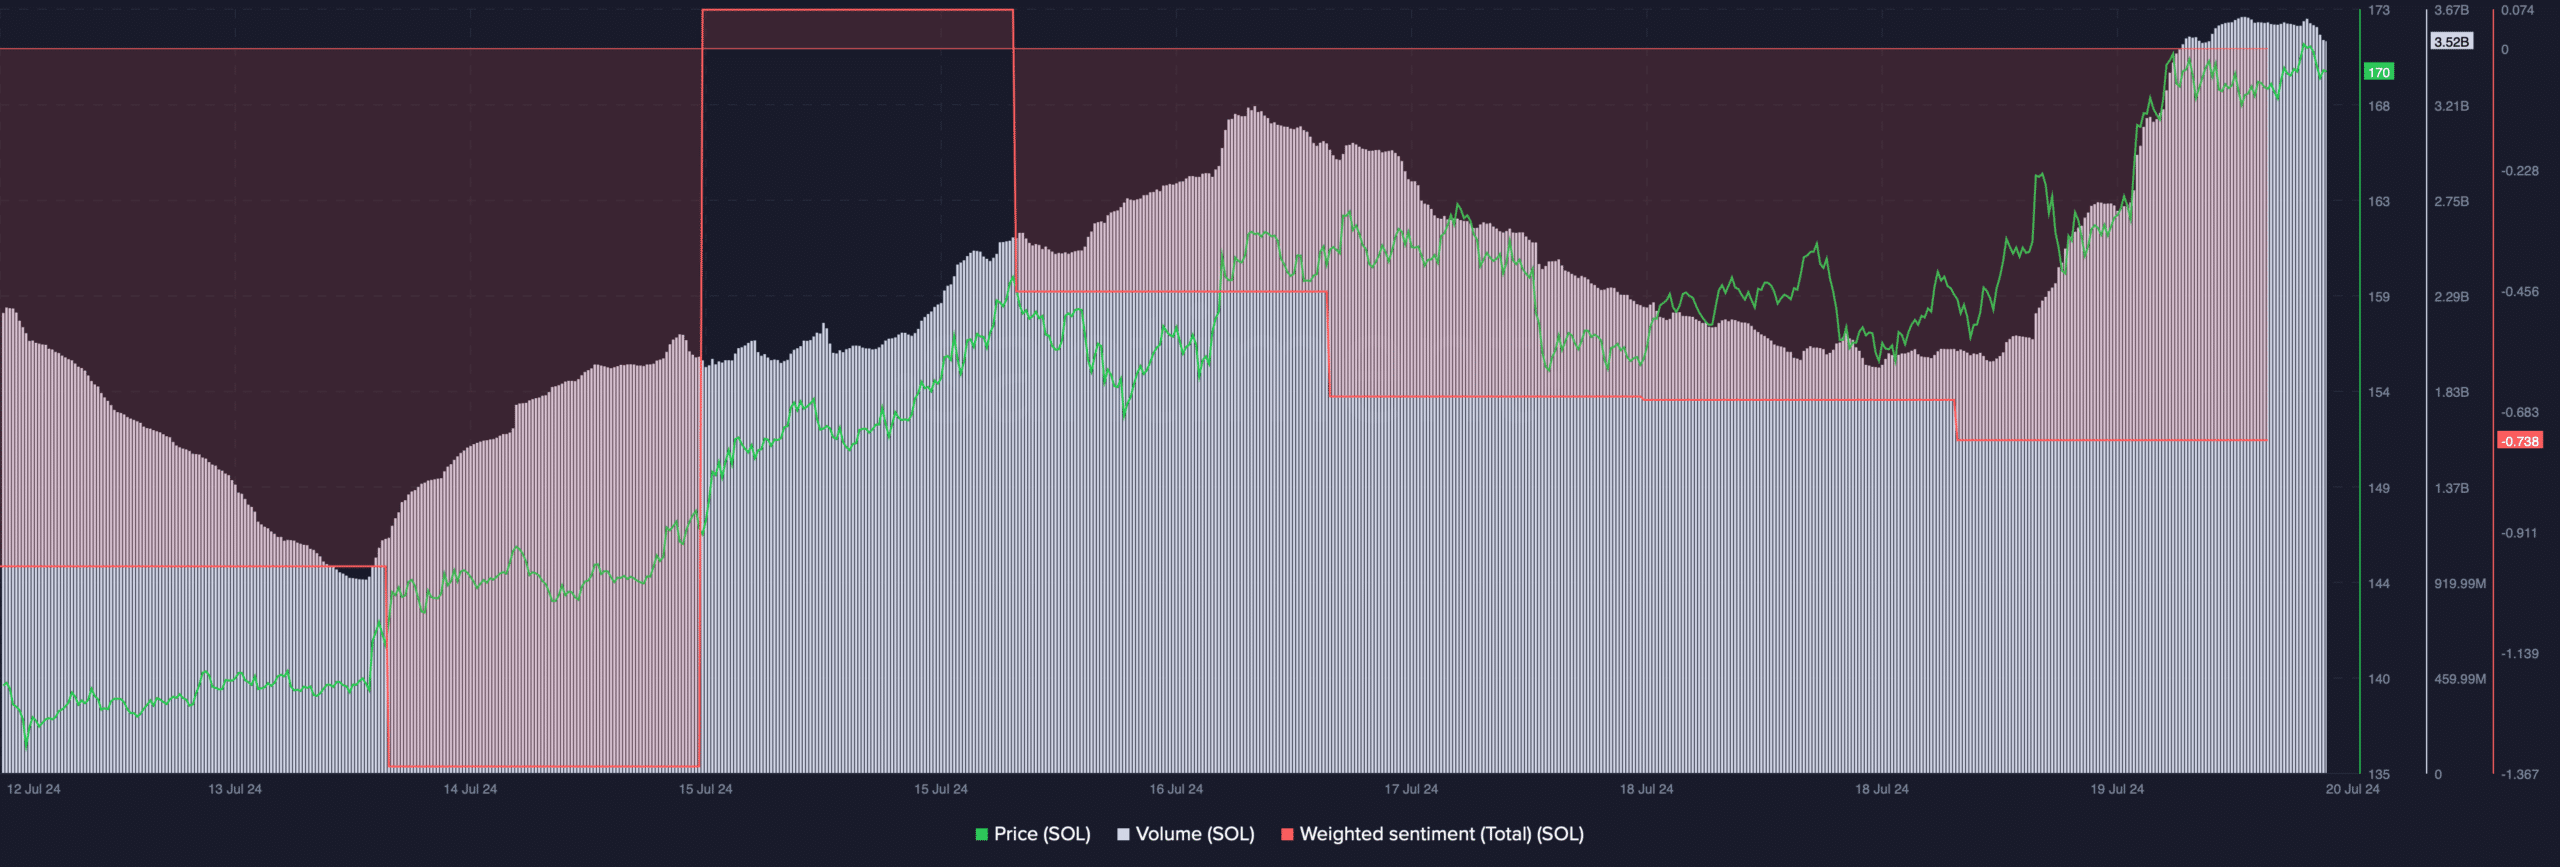
Source: Santiment
On the price charts, the technical indicator MACD displayed a clear bullish advantage in the market. However, the Chaikin Money Flow (CMF) turned bearish as it registered a downtick, indicating a possible price correction soon.
Is your portfolio green? Check out the SOL Profit Calculator
Finally, AMBCrypto’s analysis of Hyblock Capital’s data revealed that if the bulls continue to lead the market, then SOL’s path towards $200 will be pretty much clear.
However, in the event of a trend reversal, investors might see SOL dropping to $154 on the charts.

Source: Hyblock Capital


