Solana
How Solana’s on-chain data supports a move towards $185
Solana could potentially reach the $185 level if it breaches the neckline of the inverted head and shoulder pattern.

- With the recent correction, SOL has retested the breakout level of the double-bottom pattern and was heading towards $165.
- While combining on-chain metrics with technical analysis, it appears that bulls are dominating the SOL.
After a decent price correction, the overall cryptocurrency market has started moving upward. Amidst all this, the world’s fifth-largest cryptocurrency, Solana [SOL] appears bullish and poised for a notable upside rally.
Solana technical analysis and key levels
According to AMBCrypto’s technical analysis, SOL has successfully retested the breakout level of the bullish double-bottom price action pattern and was heading toward the $165 level.
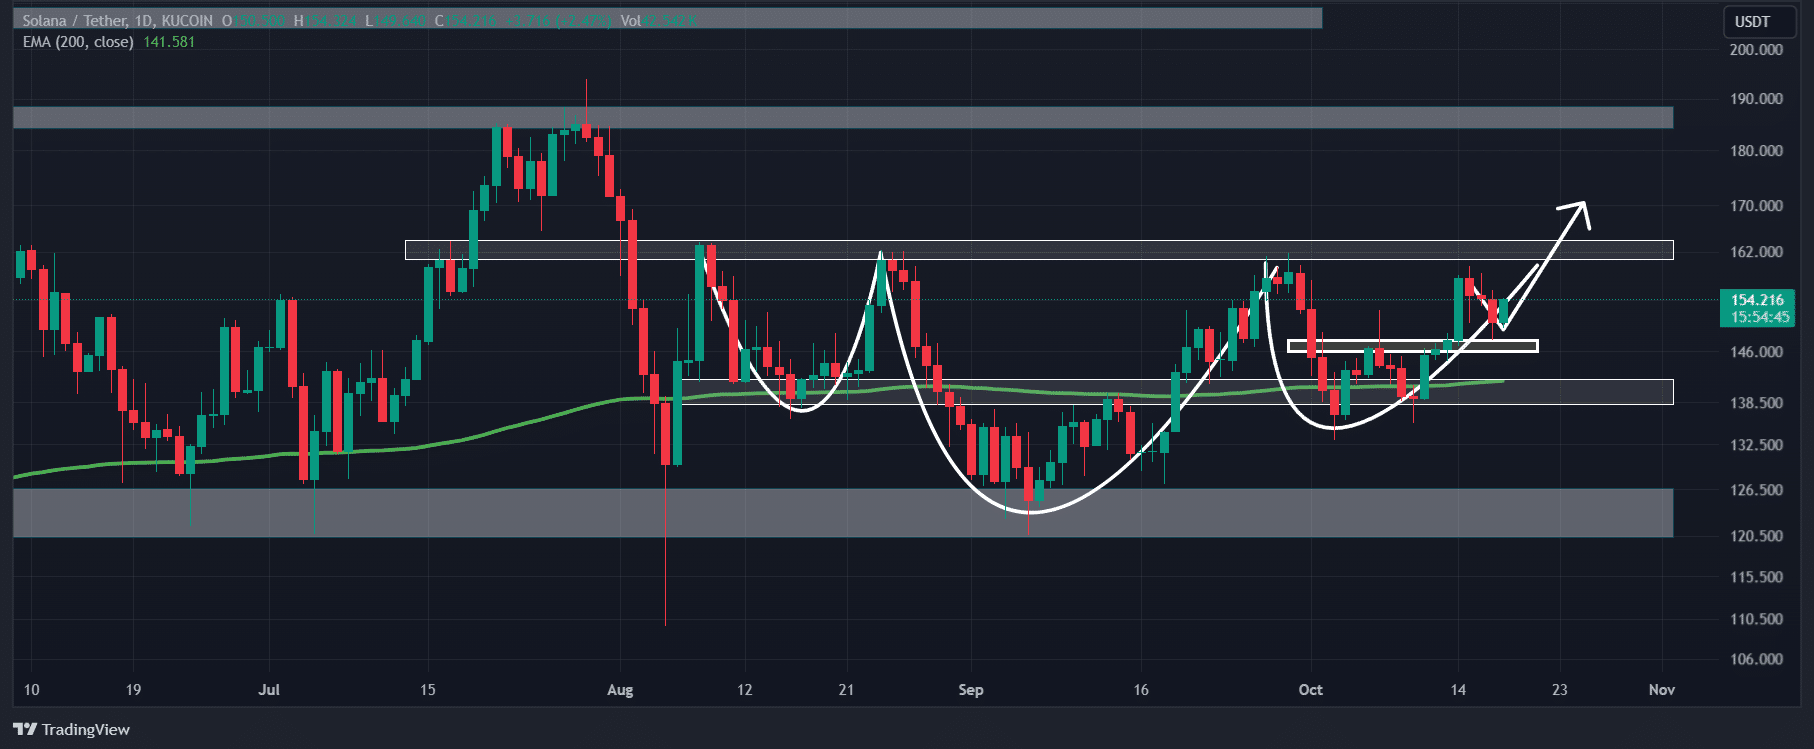
Source: TradingView
Additionally, on a daily time frame, SOL appears to be completing its bullish inverted head-and-shoulder price action pattern. However, this bullish pattern will only be completed once SOL reaches the $165 level.
As of now, there is a strong possibility that SOL could easily reach the $165 level. Meanwhile, another bullish pattern suggests a massive upside rally once it breaches the neckline of the inverted head and shoulder pattern at the $165 level.
If this speculation goes in favor, SOL could potentially reach the $185 level in the coming days. Nevertheless, trader sentiment remains bullish. Nevertheless, trader sentiment remains bullish.
Bullish on-chain metrics
SOL’s positive outlook is further supported by an on-chain analytics firm. According to Coinglass, SOL’s Long/Short ratio on the four-hour time frame currently stands at 1.089, indicating strong bullish sentiment among traders.
Additionally, its open interest has surged by 2.9% over the past four hours and has been steadily rising. This growing open interest suggests traders are placing more orders as SOL successfully retests the recent breakout level.
In the crypto industry, traders and investors often view rising open interest and a long/short ratio above 1 as bullish signs and use this data to build long positions.
Major liquidation levels
As of now, the major liquidation levels are at $149.5 on the lower side and $154.6 on the upper side, with traders over-leveraged at these levels, according to the Coinglass data.
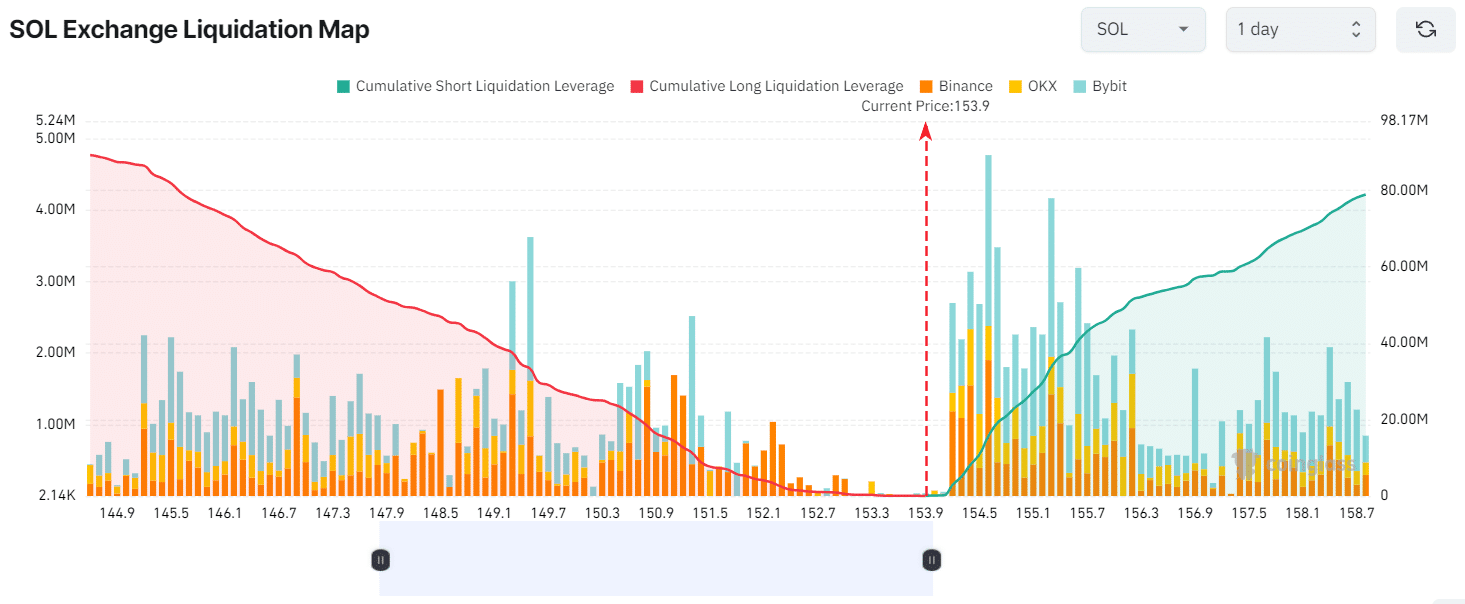
Source: Coinglass
If the sentiment remains unchanged and the price rises to $154.6 level, nearly $15.67 million worth of short positions will be liquidated.
Conversely, if the sentiment shifts and SOL’s price falls to the $149.5 level, approximately $33.28 million worth of long positions will be liquidated.
Combining these on-chain metrics with technical analysis, it appears that bulls are currently dominating the SOL and may continue to support its upside rally.
Is your portfolio green? Check out the Solana Profit Calculator
At press time, SOL was trading near $153.8 and has experienced a price surge of over 1.1% in the past 24 hours. During the same period, its trading volume dropped by 12%, indicating lower participation from traders.
However, the volume is steadily increasing following the successful retest.


