
- Solana faced major resistance at $135 and $144, where nearly 5% of its total supply is concentrated.
- Key support at $112 and $126 could stabilize price declines, but a break below $94 might trigger a sharp drop.
Solana [SOL] traders and investors closely watch the latest on-chain data as the asset navigates crucial price levels.
The UTXO Realized Price Distribution (URPD) highlights significant supply concentrations at various price points, offering insights into potential support and resistance zones.
Understanding these critical levels as SOL attempts to stabilize can help predict its next move.
Solana accumulation and support zones
One of the key accumulation zones for Solana is around $112.10, where approximately 9.7 million SOL, or 1.67% of the total supply, is concentrated.
As of the 19th of January, this level already held about 4 million SOL, indicating that long-term investors have been reinforcing their positions.
Historically, such accumulation zones often act as strong support, as investors may seek to protect their entry prices and limit further declines.
Additional support levels are located around $94, $97, and $100, which together account for nearly 21 million SOL or 3.5% of the circulating supply. If SOL experiences downward pressure, these levels could serve as critical price floors.
Below this range, supply concentration is minimal until approximately $56. This lack of significant liquidity suggests that breaking below $94 could lead to a sharp selloff.
Resistance and sell pressure
On the resistance side, significant supply concentrations exist at $135 and $144.
The $135 level has approximately 26.6 million Solana in holdings, while $144 holds nearly 27 million SOL, making up nearly 5% of the supply.
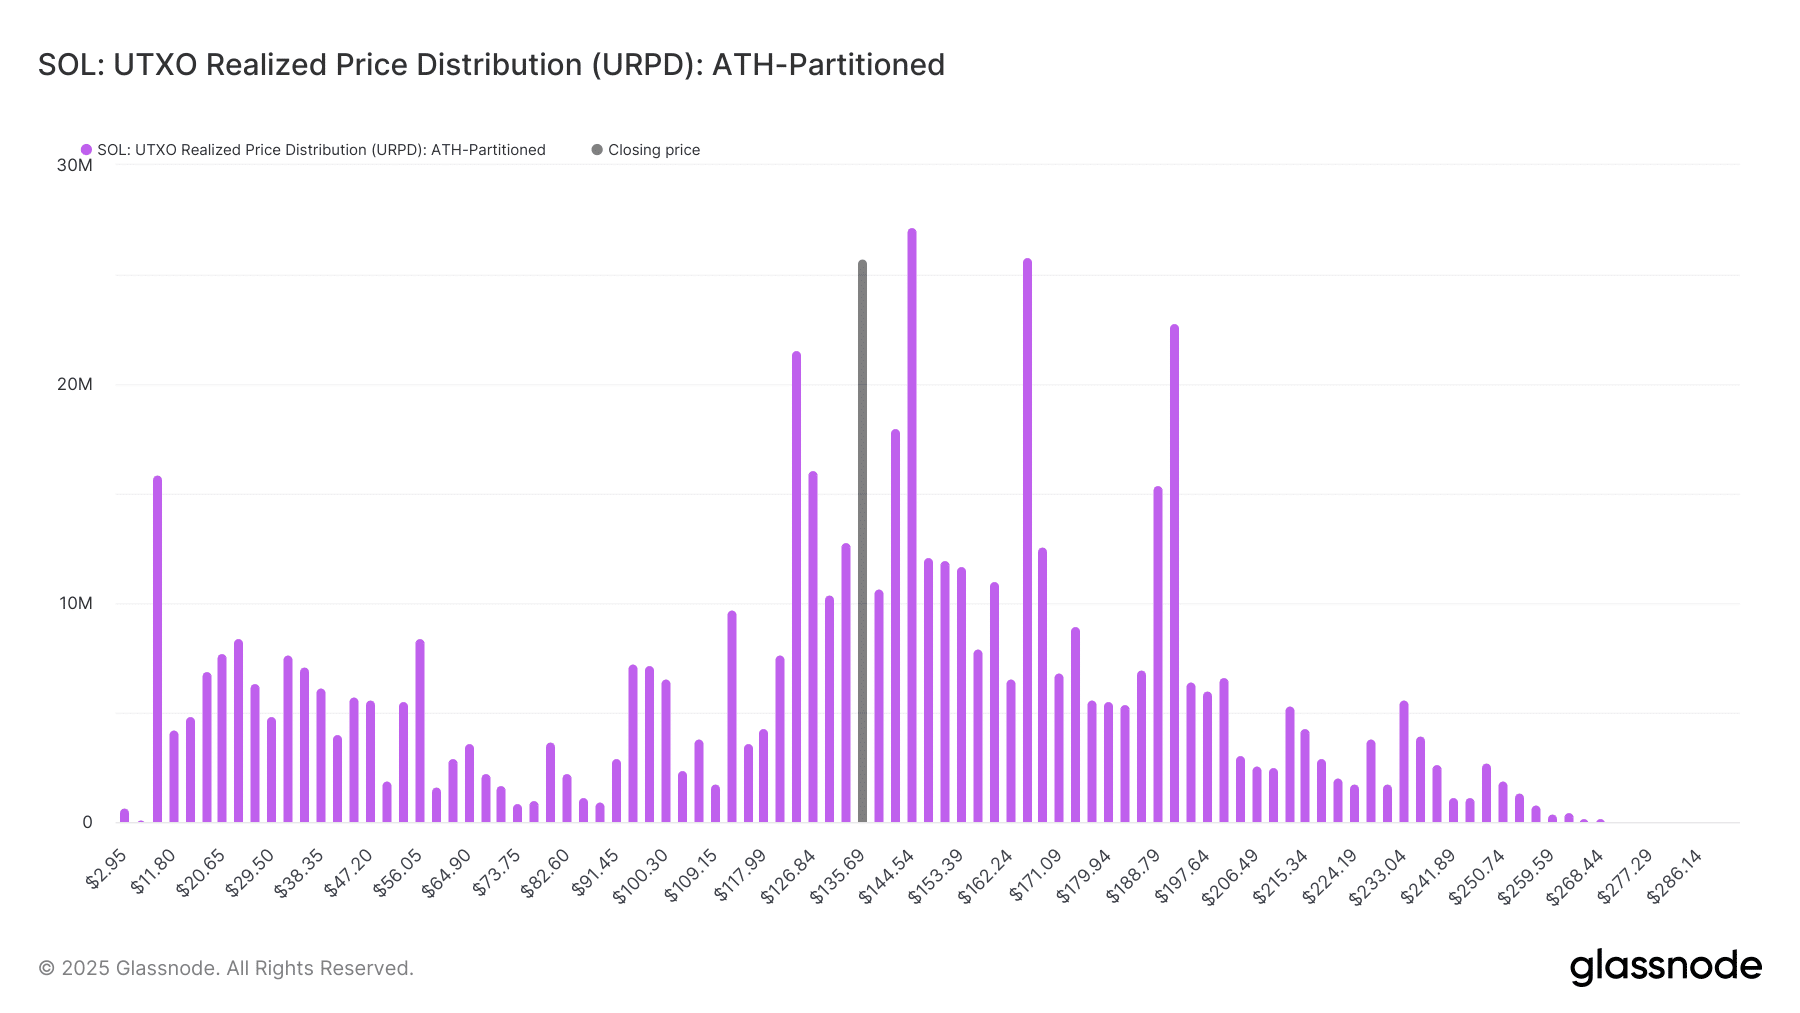
Source: Glassnode
These levels were previously significant accumulation zones, where many investors may aim to sell at break-even prices. This could lead to the formation of strong resistance.
Additionally, the URPD data highlights recent accumulation at $123 and $126, reflecting holdings of 16.2 million SOL (2.7% of the supply) and 19 million SOL (3.2% of the supply), respectively.
As a result, these levels may offer short-term stability and act as resistance points, particularly if upward momentum weakens.
How SOL could trend
Solana’s current price action suggests a battle between bulls and bears at these crucial supply zones. If buying interest sustains around the identified support levels, SOL may attempt to push past resistance near $135-$144.
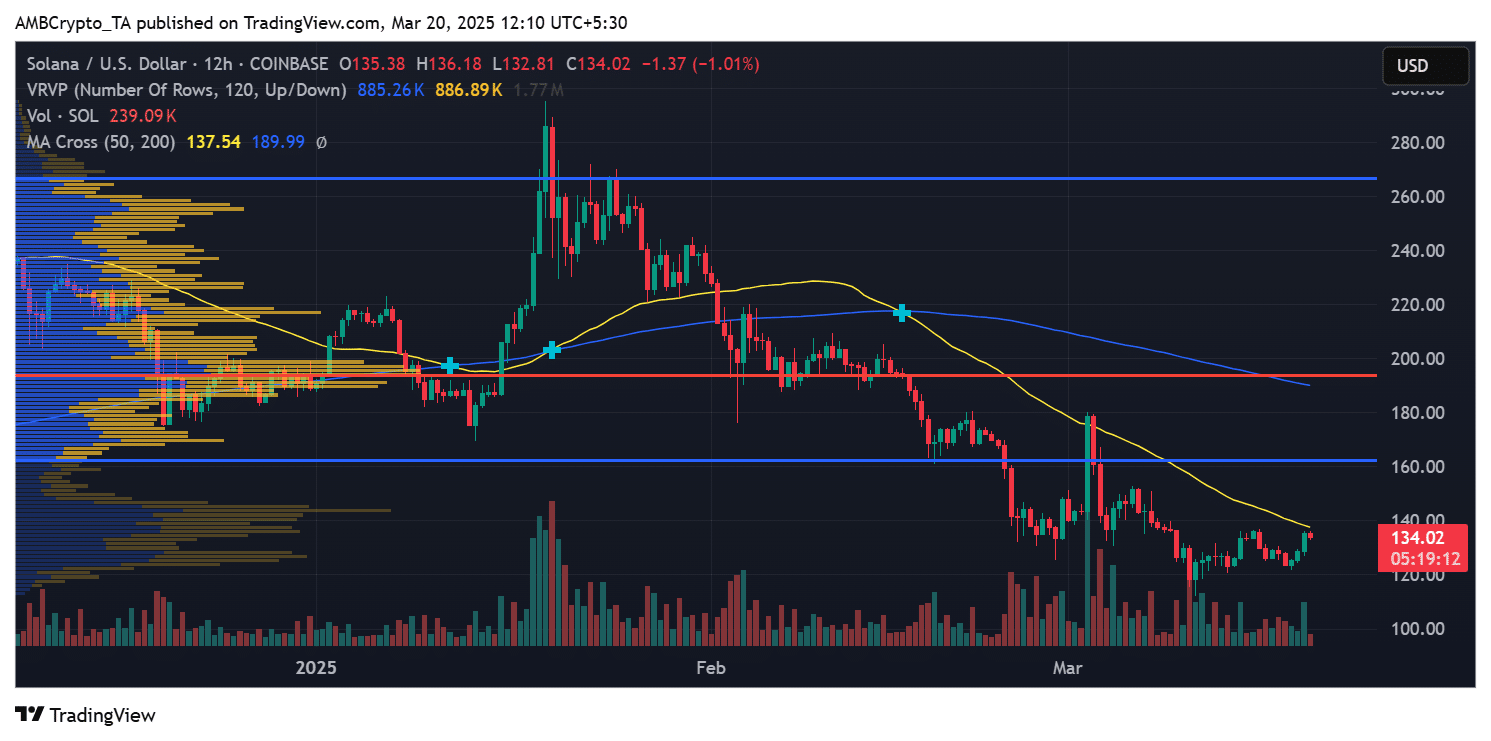
Source: TradingView
However, failure to hold above $94 could expose the asset to heightened downside risk. Traders should carefully monitor volume trends and liquidity zones to gauge the asset’s next significant move.
With these supply concentrations defining potential market behavior, the coming days will determine whether Solana can reclaim higher price levels or face further retracement.