How soon can Solana break the $190-$200 resistance zone?
The liquidation heatmap with a one-month look back period showed that $184-$196 region held a sizeable amount of liquidation levels.

- Solana has a bullish market structure.
- The five-month range high poses significant opposition.
Solana [SOL] tested the $180 resistance zone but was unable to flip it to a support zone. The price action showed that though momentum and sentiment were bullish, further gains could be tough.
Since June, Solana has traded within a range that reached from $122 to $187. On the 19th of October, the mid-range level at $154 was breached and SOL embarked on a move toward the range highs.
Rejection or breakout for SOL?
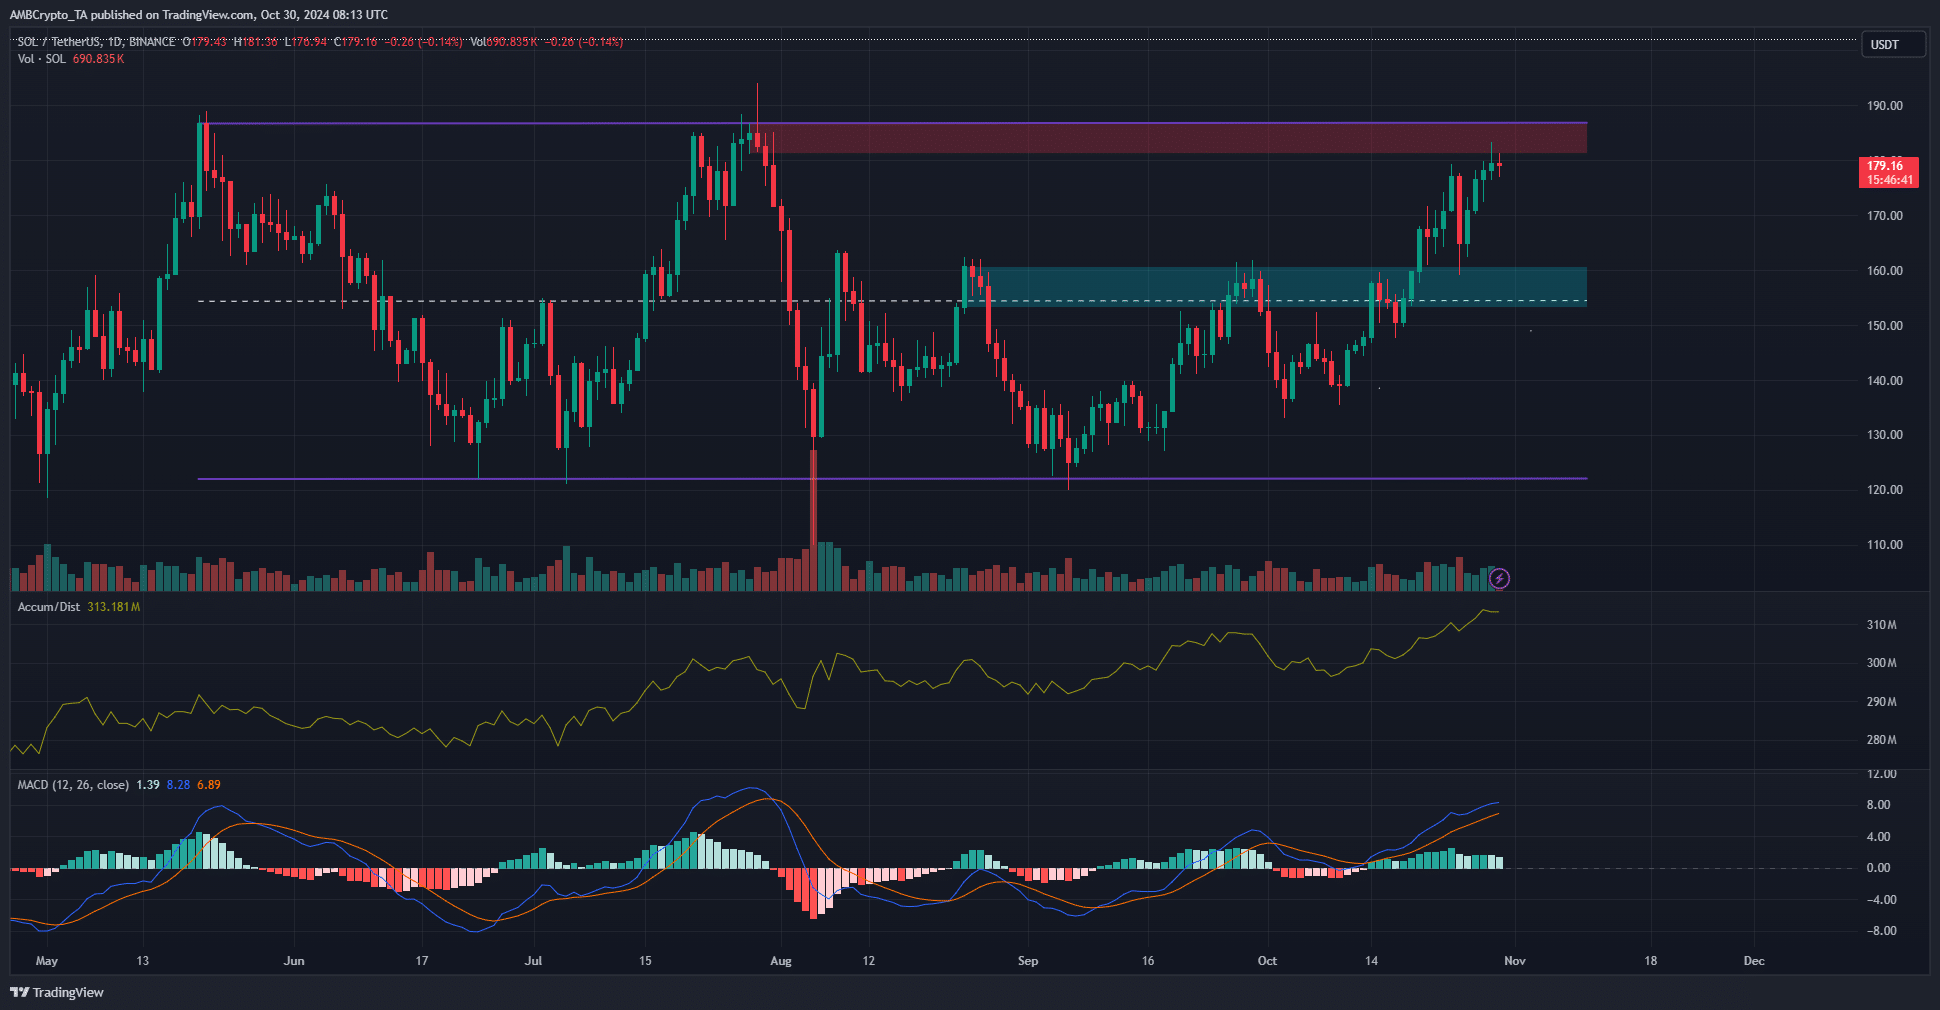
On the daily timeframe, the market structure was bullish after the $161 swing high from September was breached. The A/D indicator has been steadily trending higher in the second half of October to indicate increased buying pressure.
The MACD was also reflecting bullish momentum on the daily chart. It did not yet signal overextended conditions, or that the token could see a pullback. Whales added $35 million worth of SOL to their bags recently, raising the optimism amongst the bulls.
Despite this, the strong likelihood of rejection from $190-$200 comes from the range formation and the liquidity pockets.
In general, it is better to trade a range as it is, instead of looking for a breakout during each retest of the extremes. The surge to $194 on the 29th of July, followed by a 43.3% decline over the next week, is an example that showed the importance of time in reclaiming the range highs as support.
Magnetic zones to the north attract prices
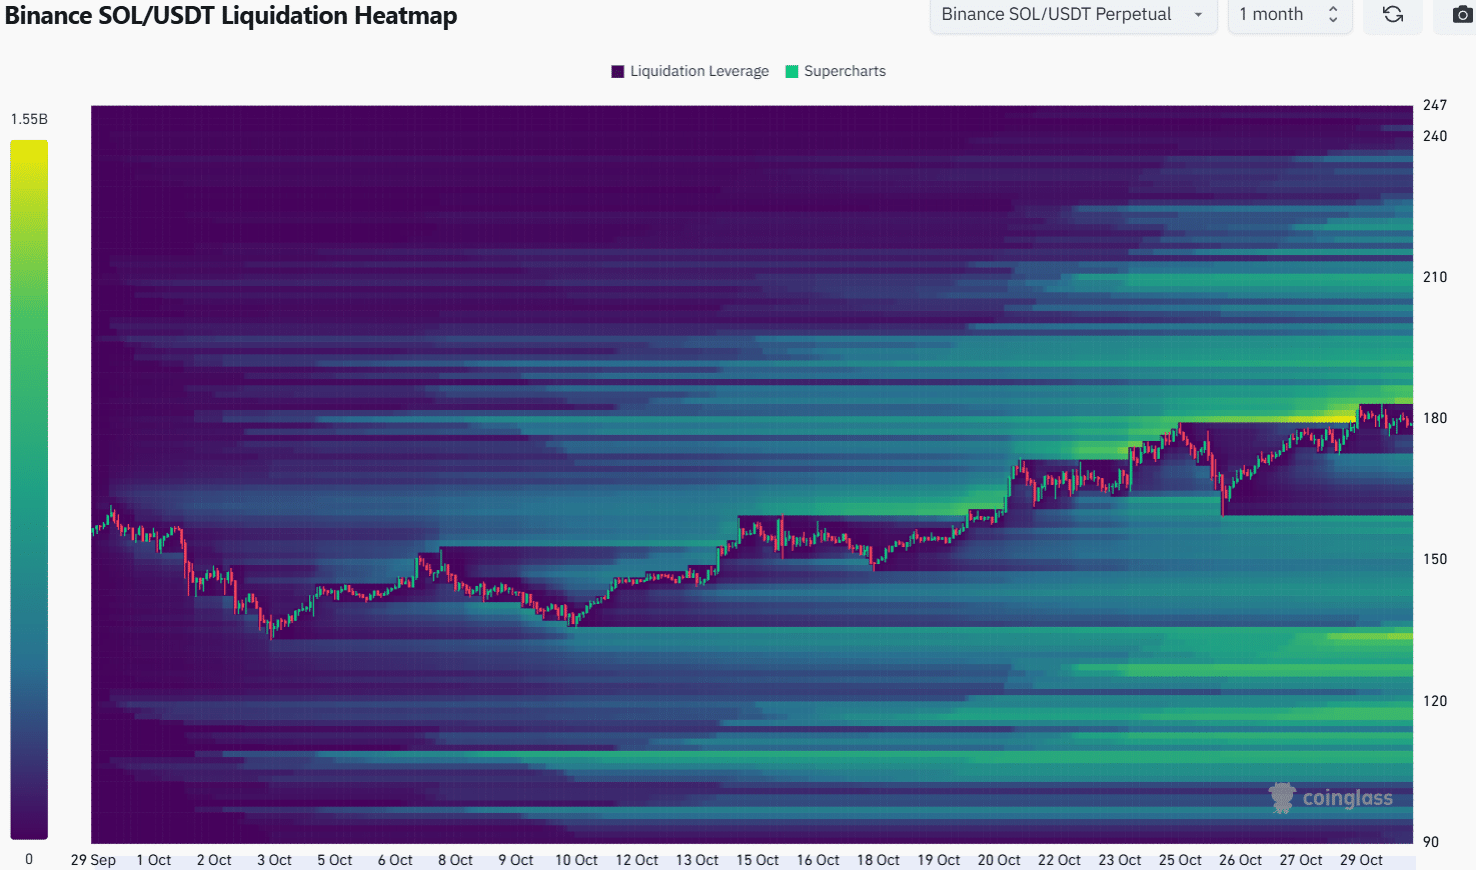
The liquidation heatmap with a one-month look-back period showed that the $184-$196 region held a sizeable amount of liquidation levels. It is likely that Solana prices would be attracted to this region before a bearish reversal.
Realistic or not, here’s SOL’s market cap in BTC’s terms
Such a reversal is not guaranteed, especially with Bitcoin [BTC] nearing its all-time high and bullish sentiment gaining traction. Yet, traders should be prepared for both situations.
A move beyond $195 and a retest of $190 in the coming days can offer a buying opportunity.
Disclaimer: The information presented does not constitute financial, investment, trading, or other types of advice and is solely the writer’s opinion