- Hyperliquid has a bearish market structure across multiple timeframes.
- The swift bounce on the 7th of March had volume behind it, but it did not promise a breakout.
Hyperliquid [HYPE] fell to $9.29 on the 7th of March, after the market-wide selling, but it bounced 35% within a day of making those lows.
This bounce caused the technical indicators on the lower timeframe (4-hour) to shift bullishly, but the other clues showed bearishness.
The market structure on both the 1-day and 4-hour charts was bearish, but they both outlined a key resistance level for HYPE bulls to overcome in the coming days to enforce a recovery.
HYPE bulls need to reclaim $12, but is that a big ask?
Source: HYPE/USDT on TradingView
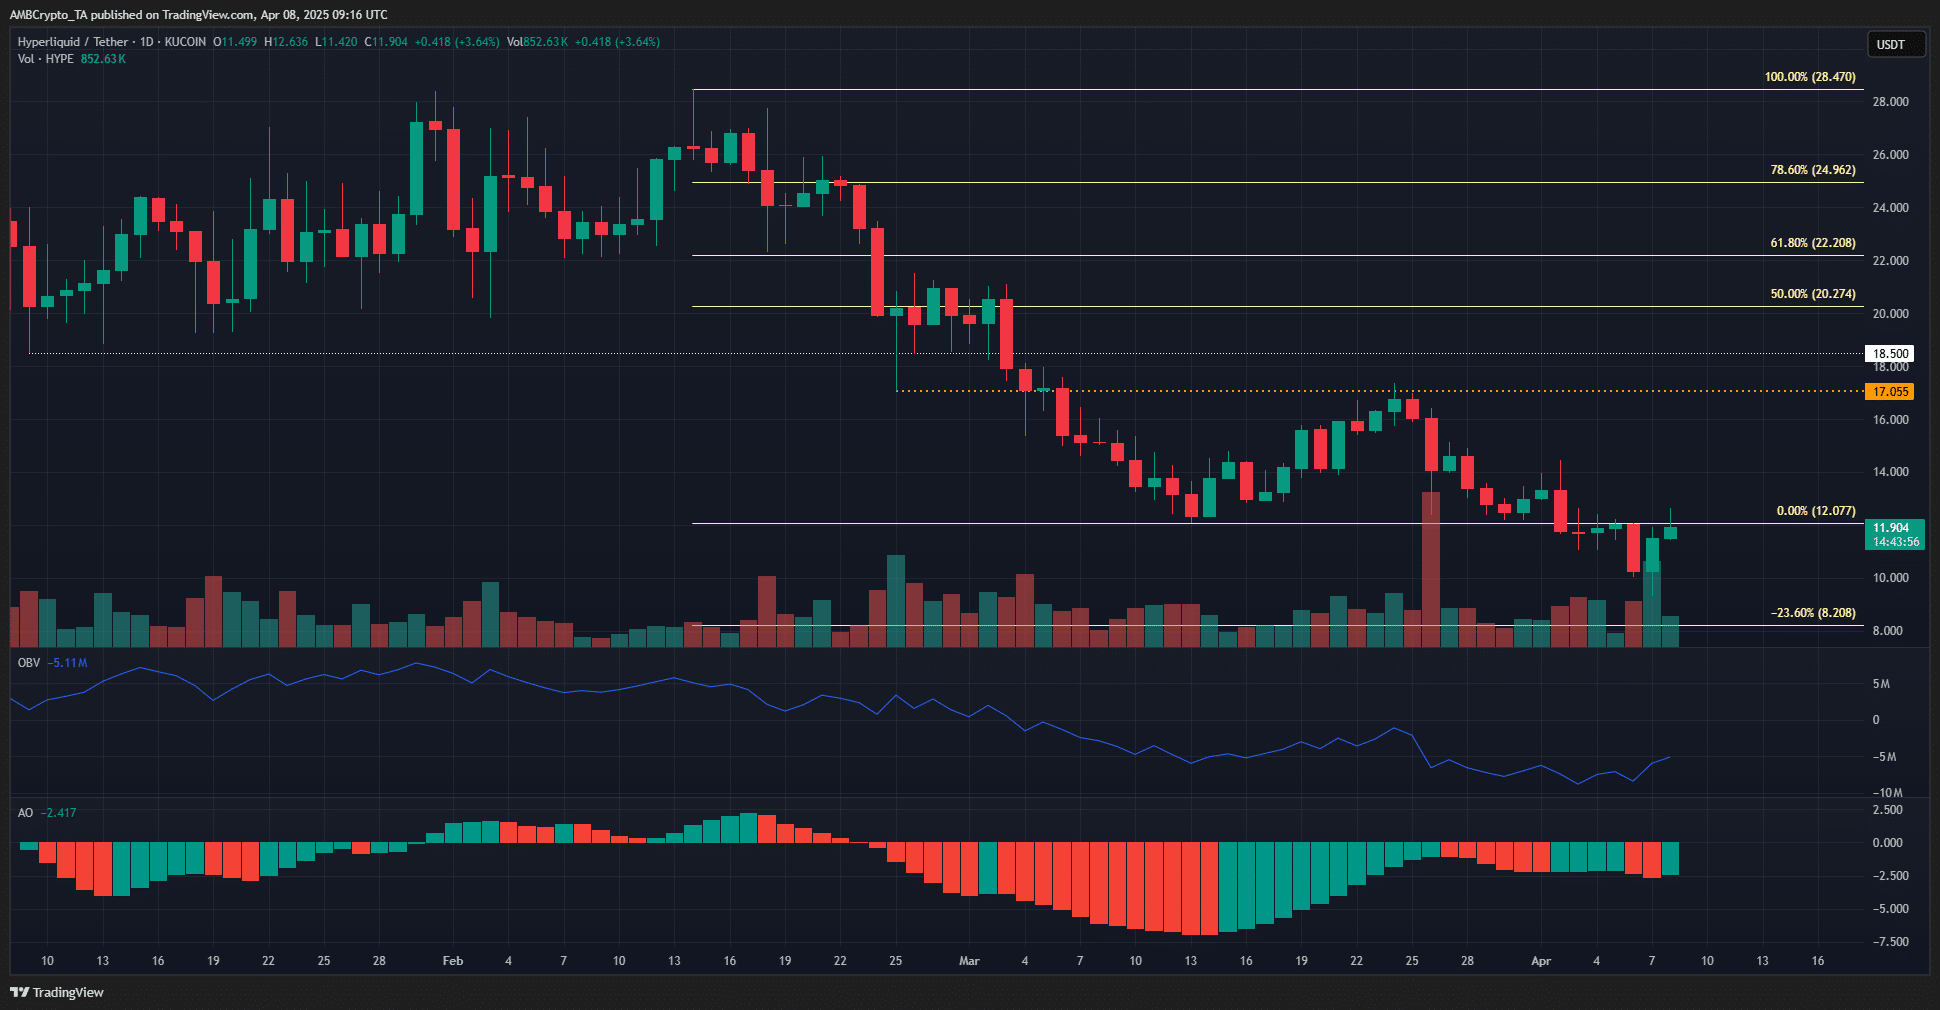
In March, Hyperliquid bulls successfully defended the $12 level, even during its second retest. By the final week of March, a range formation and consolidation seemed likely. However, fearful market conditions shifted expectations.
HYPE dropped below $12 to test $10, strengthening the bearish bias. This bearish trend had been evident since February, as the OBV showed a consistent downtrend, indicating steady selling pressure.
The Awesome Oscillator also highlighted six weeks of downward momentum. At press time, a retest of $12 as resistance appeared likely, potentially leading to a move toward $8.2, the next Fibonacci extension level.
Source: HYPE/USDT on TradingView
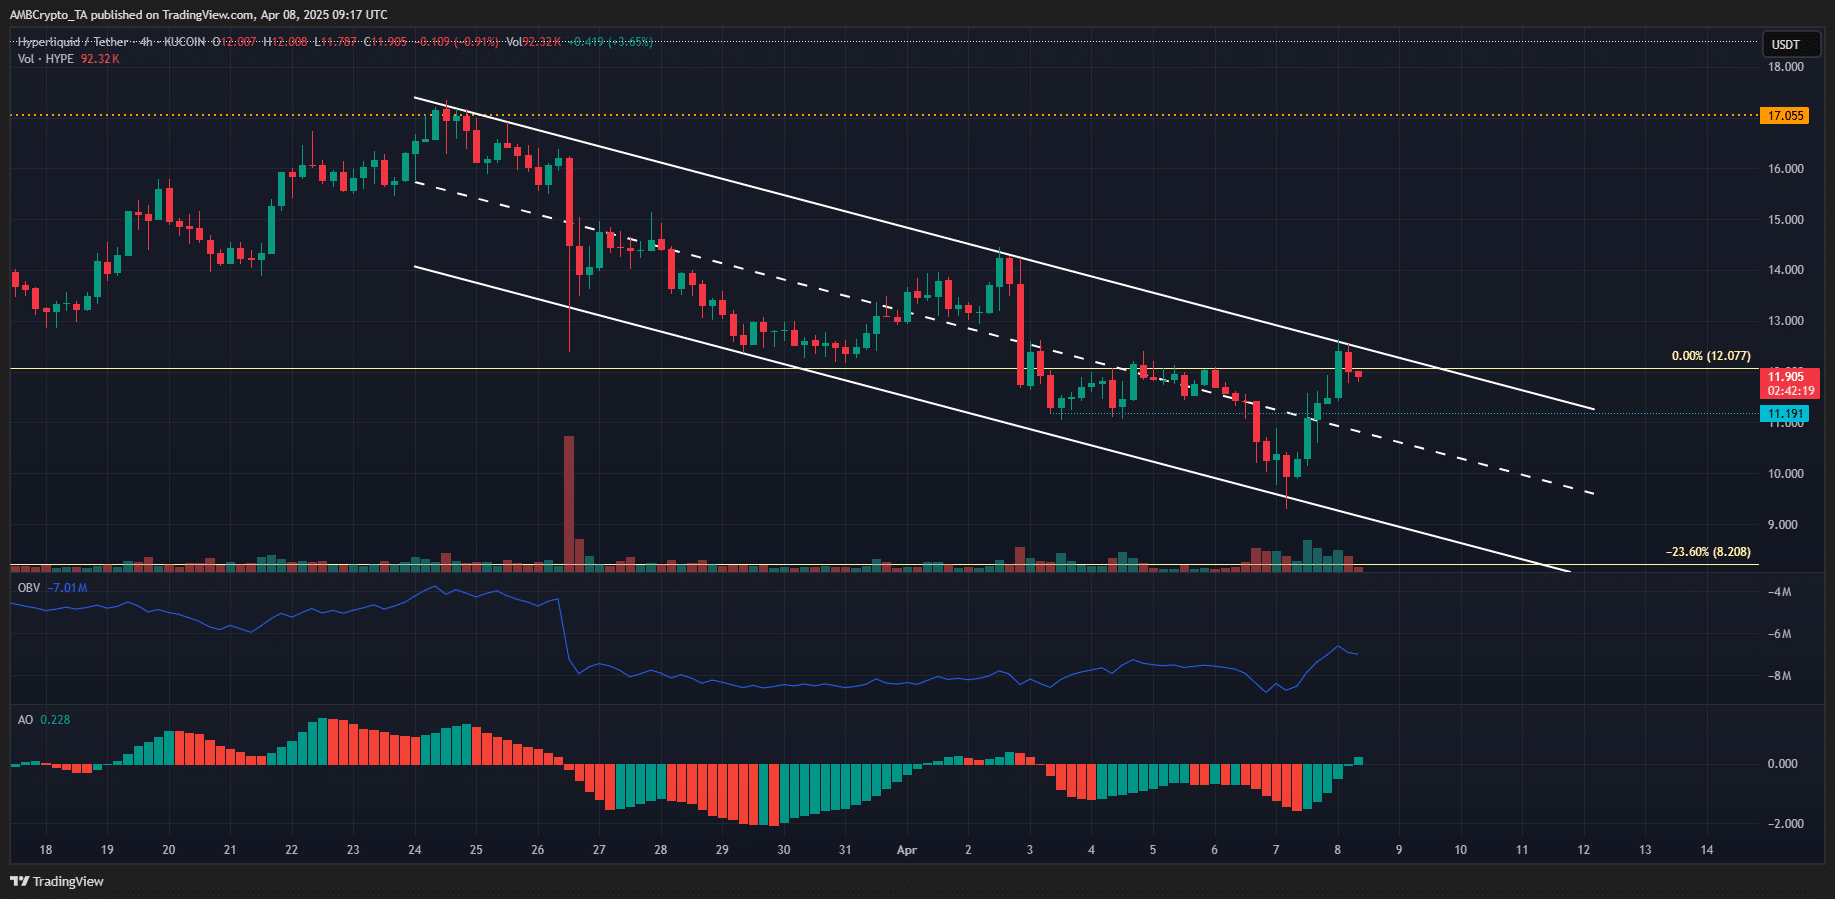
The 4-hour chart showed a descending channel formation in the past two weeks. At press time, the high of the channel had forced HYPE prices to falter. This was a disappointment to the bulls, who expected a breakout based on the OBV’s movement.
The OBV set a new high compared to the past ten days. The Awesome Oscillator also poked its head above the zero line to indicate bullish momentum after the bounce from the channel’s low at $9.54.
Since the higher timeframe bias was bearish, and the $12 level was a key resistance level, it was likely that Hyperliquid would fall to the $11.2 support zone next. The mid-level of the channel was also a promising dynamic support.
Disclaimer: The information presented does not constitute financial, investment, trading, or other types of advice and is solely the writer’s opinion