Hyperliquid loses mid-range support as short-term selling pressure builds
Hyperliquid has slipped below its $64 mid-range support and could be headed towards $50 next.



The Hyperliquid chain’s total Open Interest reached $11.07 billion on July 13, the highest in 2026. HIP-3 markets, or Hyperliquid Improvement Proposal 3, contributed to $3.69 billion, another record, reported Wu Blockchain in a post on X.
Just a couple of days ago, though, it was reported that the new Ethereum Layer-2, Robinhood Chain, had surpassed Hyperliquid and BNB in daily speculative interest.
Viral memecoin launches like CashCat helped fuel the Robinhood volume, and it is unclear if this enormous volume can be sustained during periods of less memecoin speculation.
Hyperliquid is a market-proven product. Will this be enough for its price trends to improve in July?
The Hyperliquid uptrend remains intact
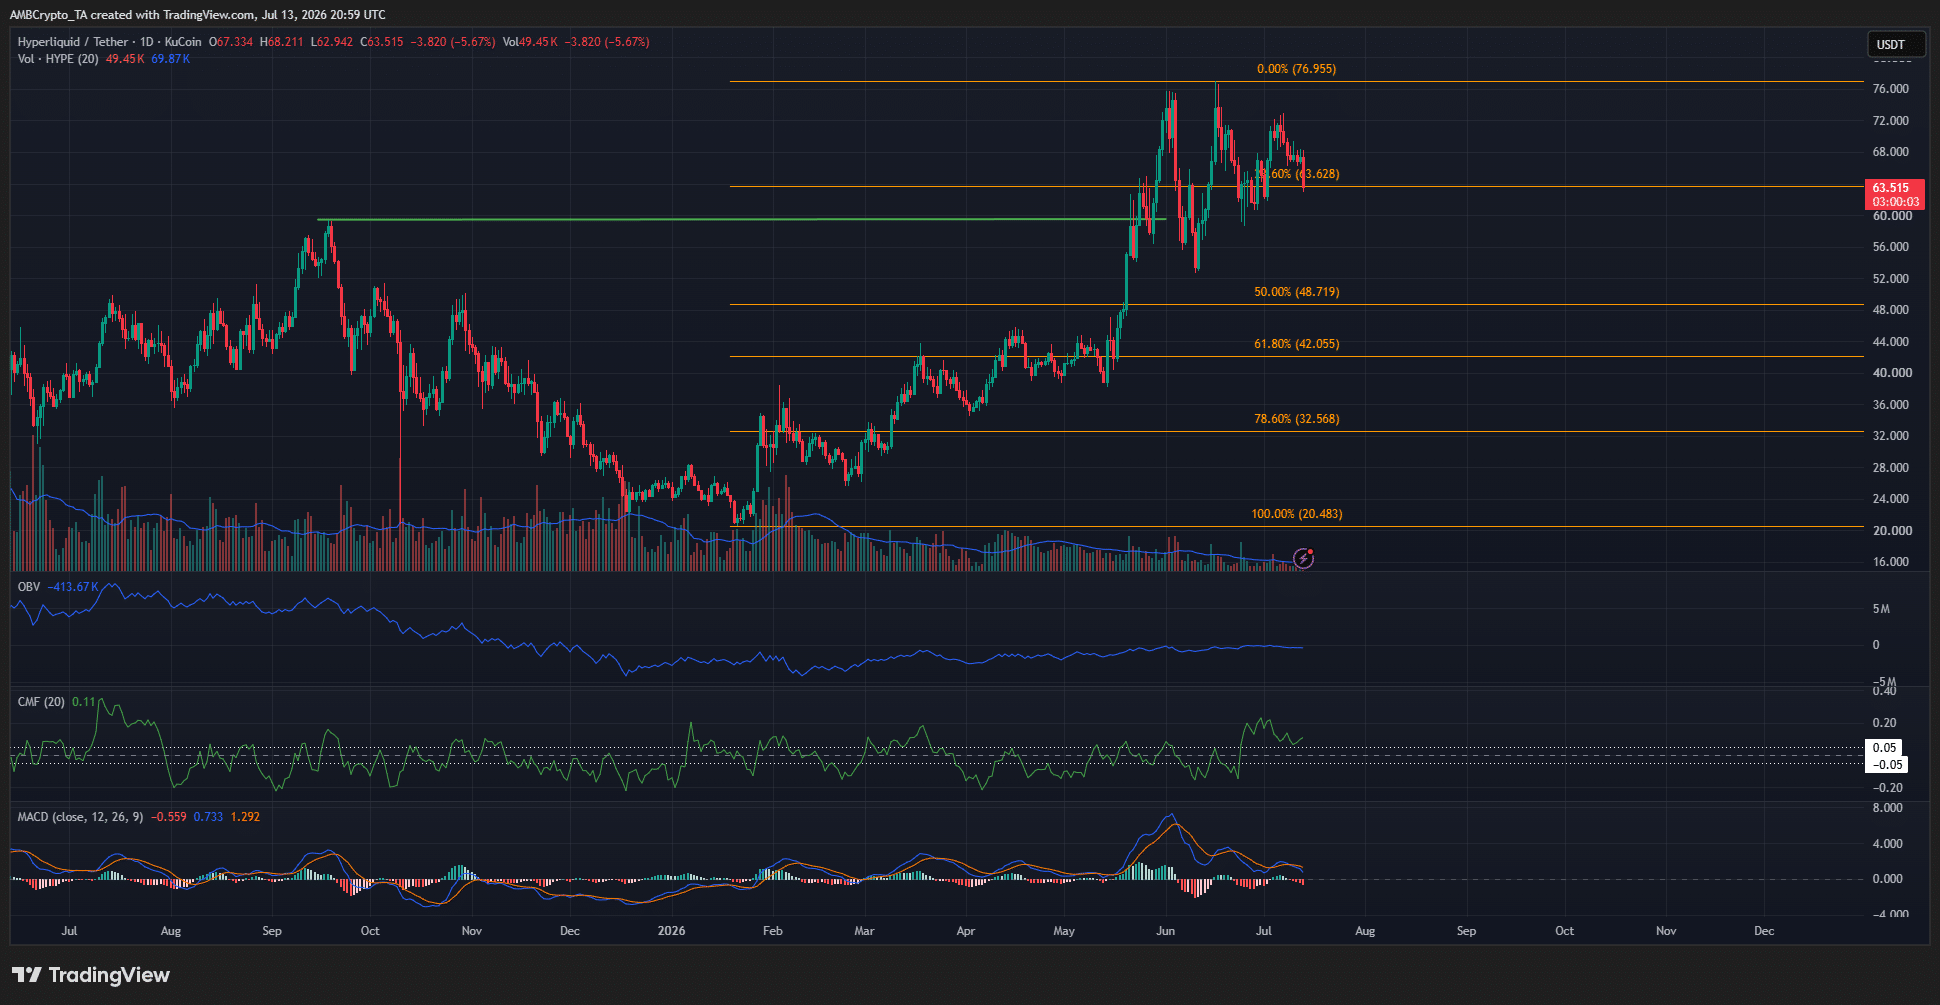
A bullish swing structure was in place for HYPE. An upward continuation was established when the previous swing high at $59.412 [green] was breached to the upside in May. Since then, the altcoin has set a new high at $76.955.
Using the move from $20.48 to $76.95, a set of Fibonacci retracement levels [orange] was plotted. It showed that the coveted golden pocket for swing traders and investors sat in the $32.56-$42.05 area.
The golden pocket outlines a high-probability trend resumption zone between the 61.8%-78.6% retracement levels. Therefore, in the long run, a correction to this region should offer an investing opportunity.
As things stand, HYPE is a long way from such a massive retracement. The CMF was above +0.05, and the OBV was climbing, to show steady buying pressure. Meanwhile, the MACD signaled waning bullish momentum.
Traders’ call to action- Respect the range
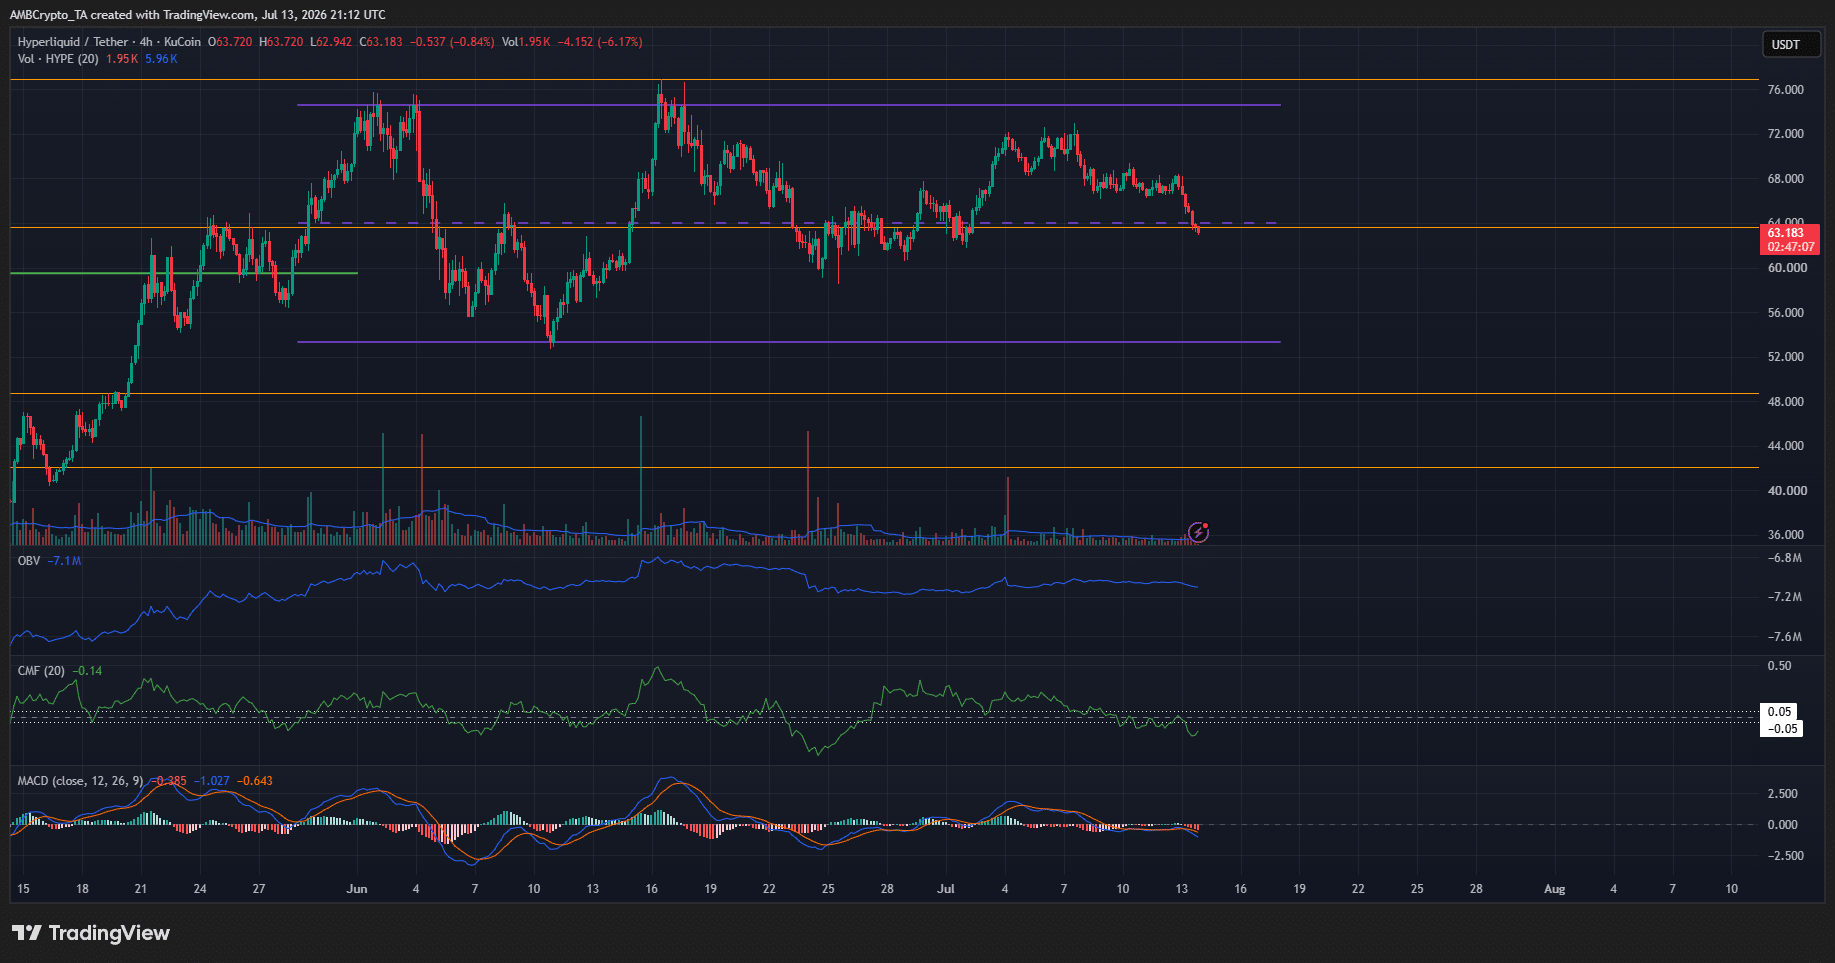
A range formation between $53.3 and $74.6 has been in place since early June. At the time of writing, the Hyperliquid token was trading below the mid-range support at $64.
This signaled a potential drop toward the lower end of the range. The CMF’s -0.14 reading showcased heavy capital outflows. The MACD has formed a bearish crossover below the zero line to signal that downward momentum was gaining strength.
Swing traders can wait for a drop toward $53-$54 before looking to buy. It is also possible that the $60 round-number level might yield a price bounce.
As things stand, traders can wait for this range to break down before they can begin anticipating a correction toward $32.
Final Summary
- Hyperliquid reached its highest Open Interest of 2026 on Monday. Robinhood Chain’s surge in daily speculative interest recently might not be enough to topple the leading DEX.
- The higher timeframe HYPE price trends were bullish. For now, the $53.3 and $74.6 levels were the ones swing traders should watch.