Hyperliquid price prediction – Assessing why HYPE’s uptrend is still in play
HYPE might be forced below the $50-mark once again, but investors can remain calm.

Since hitting an all-time high of $75.51 on 02 June, Hyperliquid [HYPE] has retraced by 21.2% on the charts. The recent losses came alongside a steep Bitcoin [BTC] sell-off that took its price from around $74K to below $59K.
Despite the market-wide pessimism and Bitcoin’s bearish trajectory though, Hyperliquid bulls have reason to stay hopeful. They might need to bide their time though.
Why Hyperliquid remains a solid investor bet
In a recent report, AMBCrypto revealed that the fundamentals of Hyperliquid have been strong still. Growing TVL and rising on-chain activity seemed to hint at capital inflows to the ecosystem, with strong fee-generation revealing user conviction in the product.
At the same time, smart money trends alluded to the notion that stable Bitcoin could produce bullish conditions for HYPE.
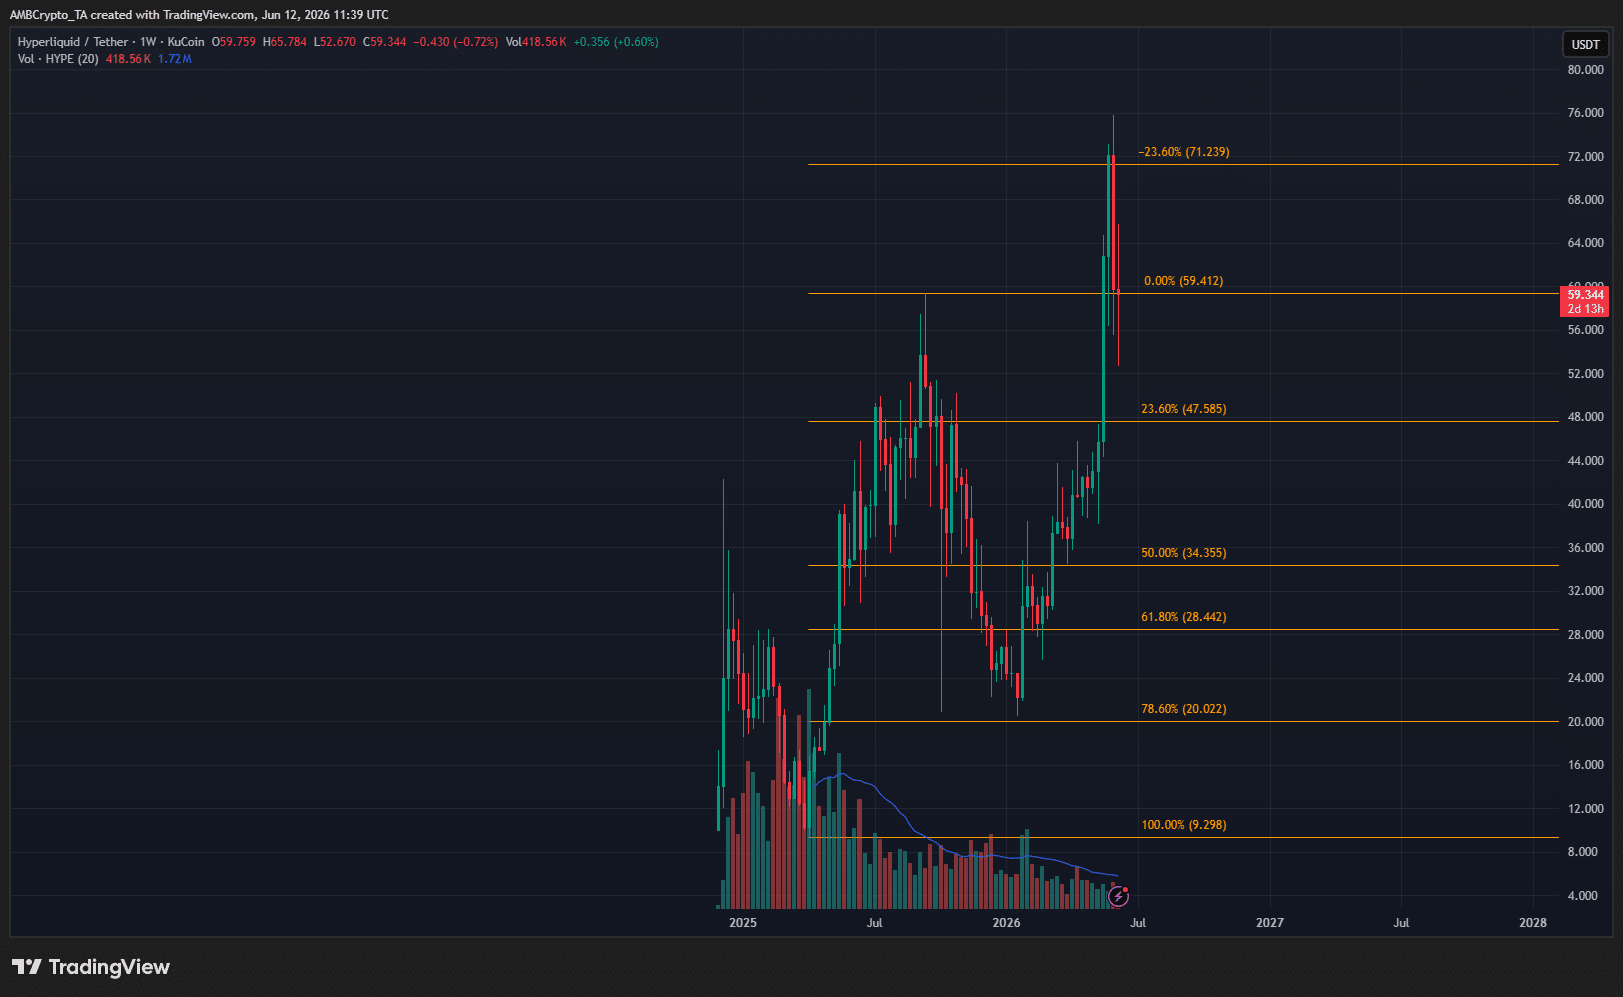
The swing structure on the weekly chart was bullish, and the key Fibonacci retracement and extension targets have been hit over the past six months.
The inability to stay above the 23.6% extension level at $71.2 implied a retracement wave could be underway next.
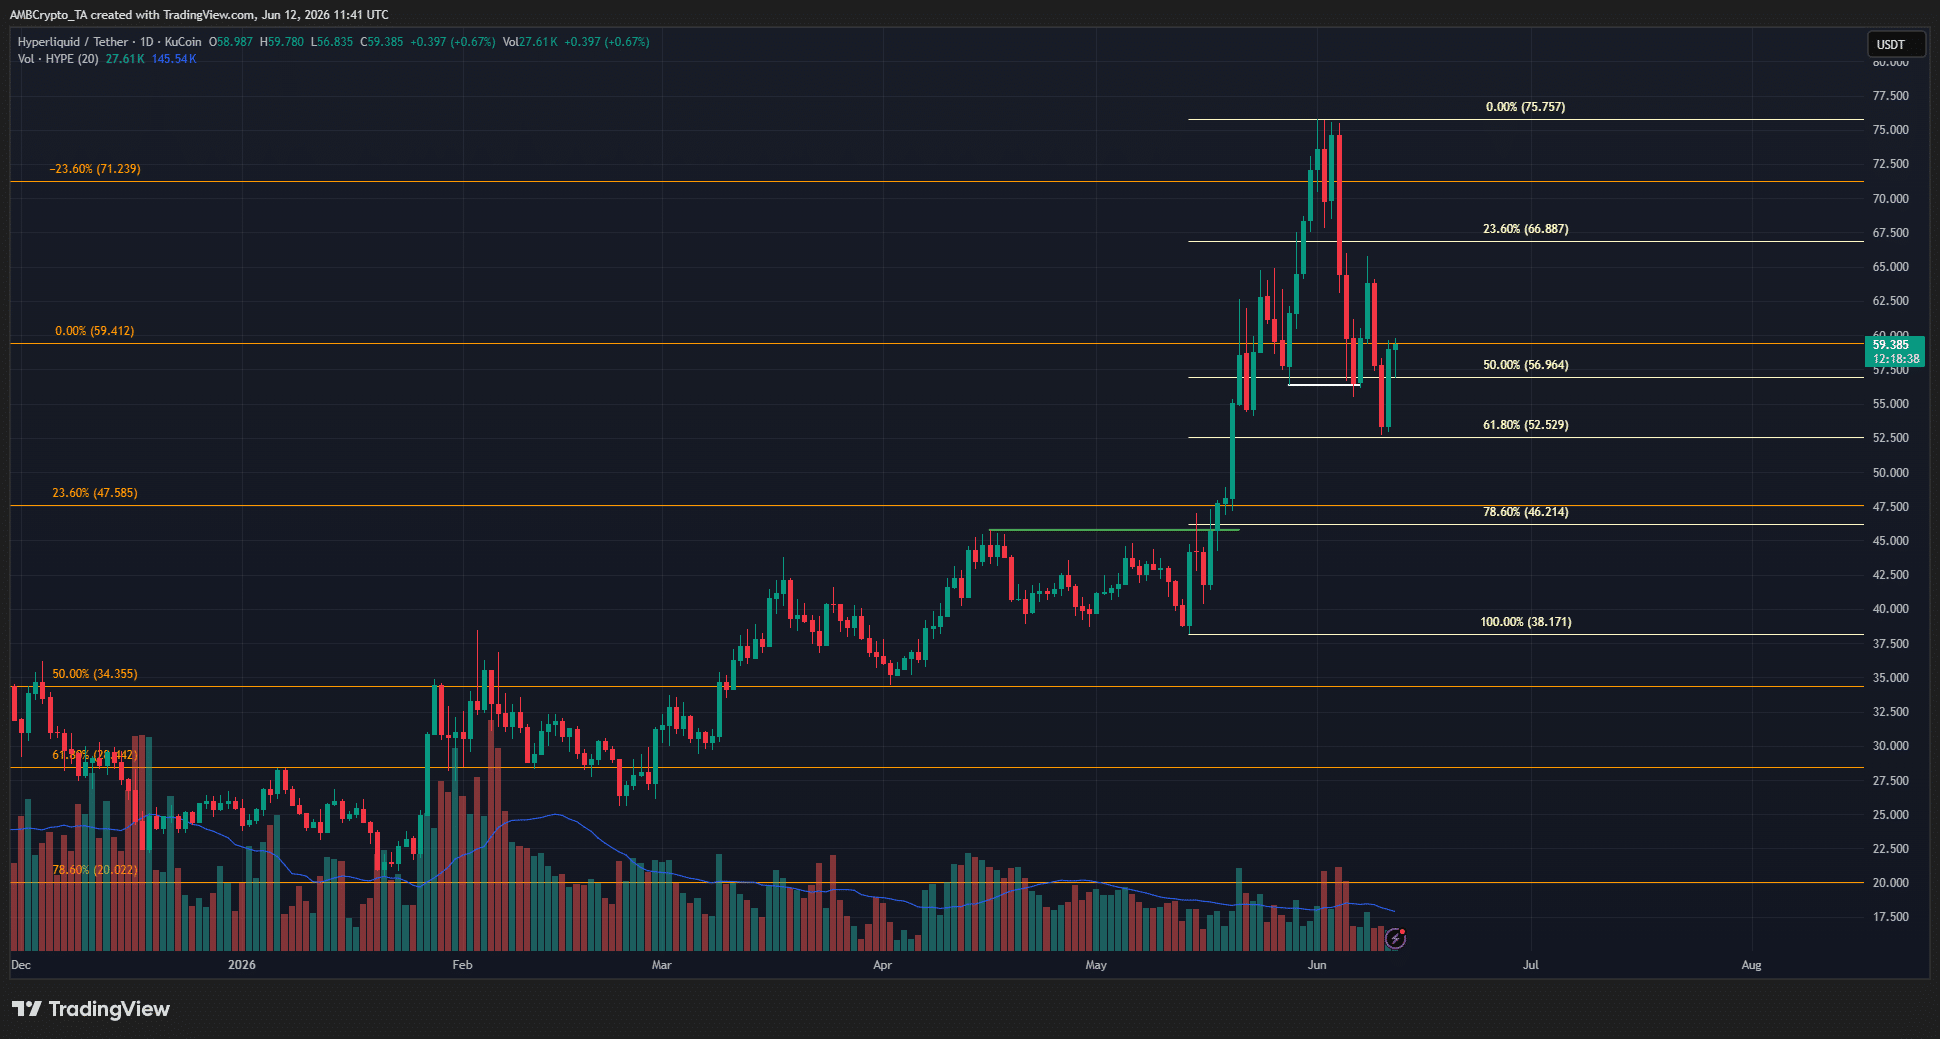
Zooming in on the 1-day chart, we can see a bullish structure in place on this timeframe too. The swing structure’s break (green) was followed by an internal bearish shift (white).
The bearish internal structure meant that traders can expect a pullback towards the swing low at $38.17, though this pullback could stall at $46.21 or $52.52 – The key southward Fibonacci retracement levels.
Traders’ call to action – Sell, or wait to buy
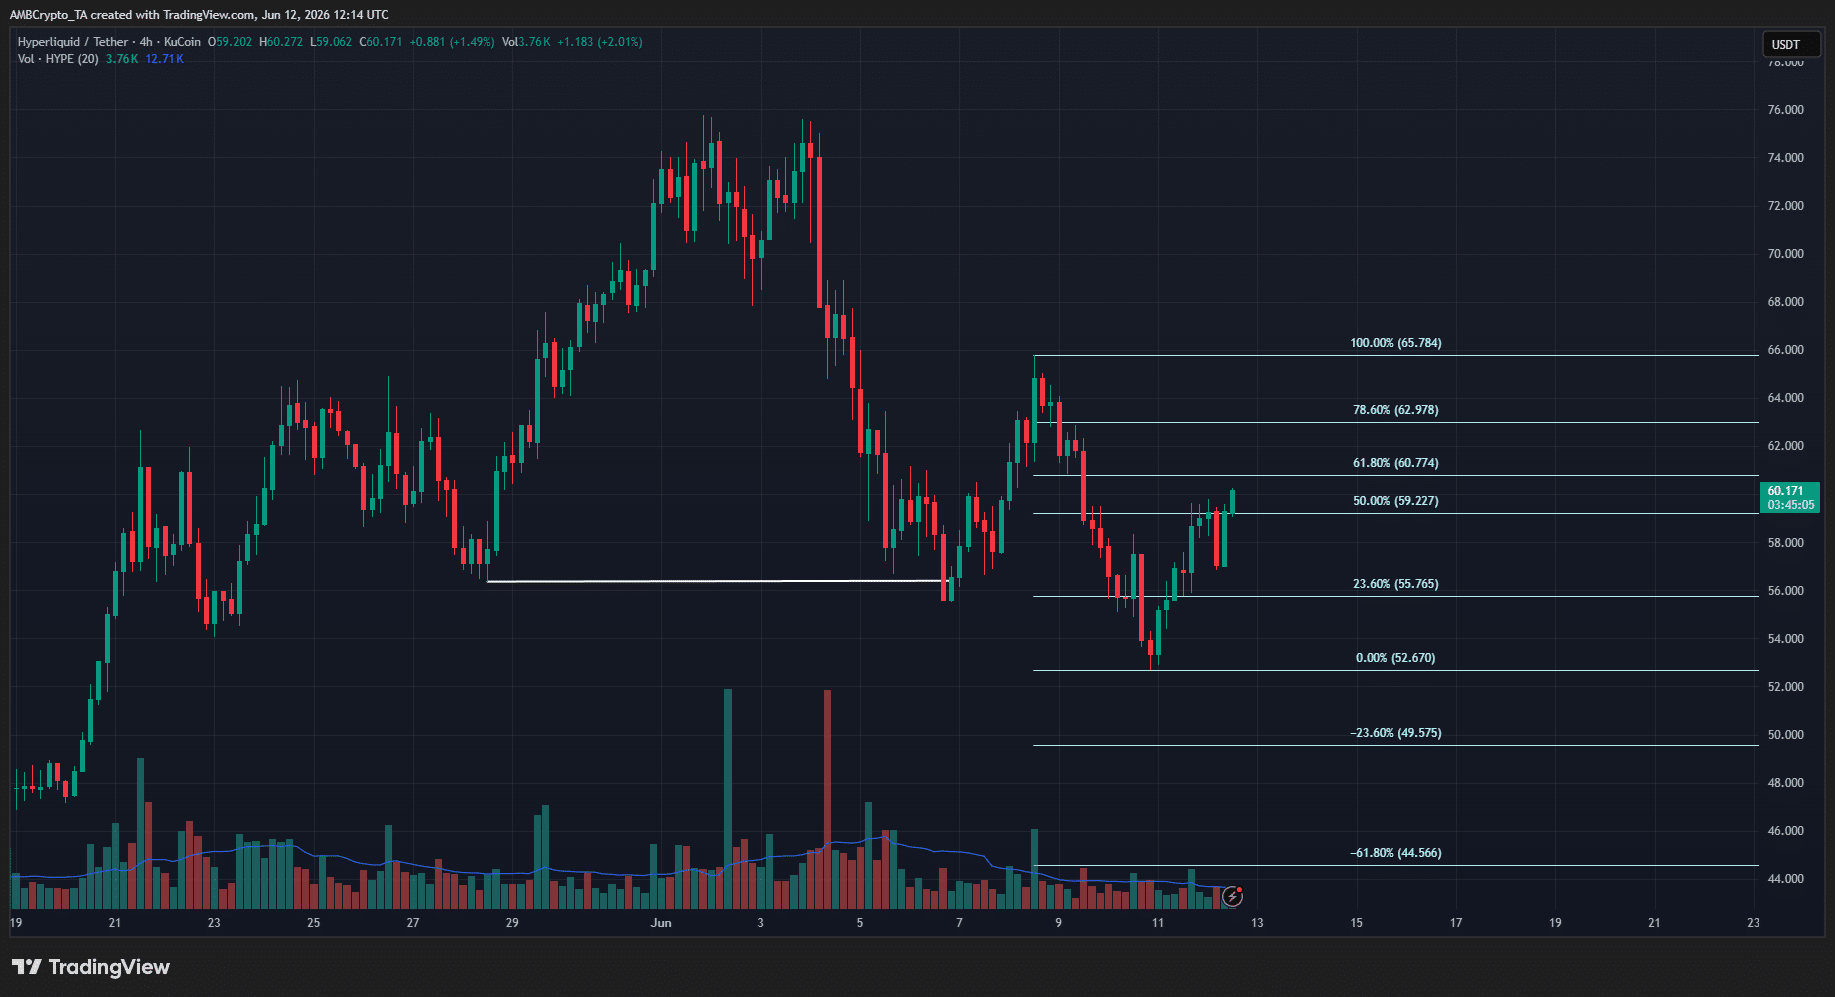
The 4-hour swing structure was bearish, and a bounce appeared to be underway. This bounce could climb to $63 before resuming the downward move towards $46.
Traders can choose to sell this bounce and set a stop-loss above the $65.78 high.
Alternatively, long-term investors can wait for a price drop to the $38-$46 area before making their decision on buying. This might also shed more clarity on Bitcoin’s trajectory, helping make the decision.
Final Summary
- Hyperliquid has a strongly bullish long-term outlook due to its fundamentals and revenue.
- HYPE retracement phase could go as deep as $46 and $38 in the coming weeks.