Hyperliquid price prediction: What’s next as HYPE bulls target $77 resistance?
HYPE rebounds from key support as rising trading volume and liquidity positioning shift focus toward the $77 resistance level.

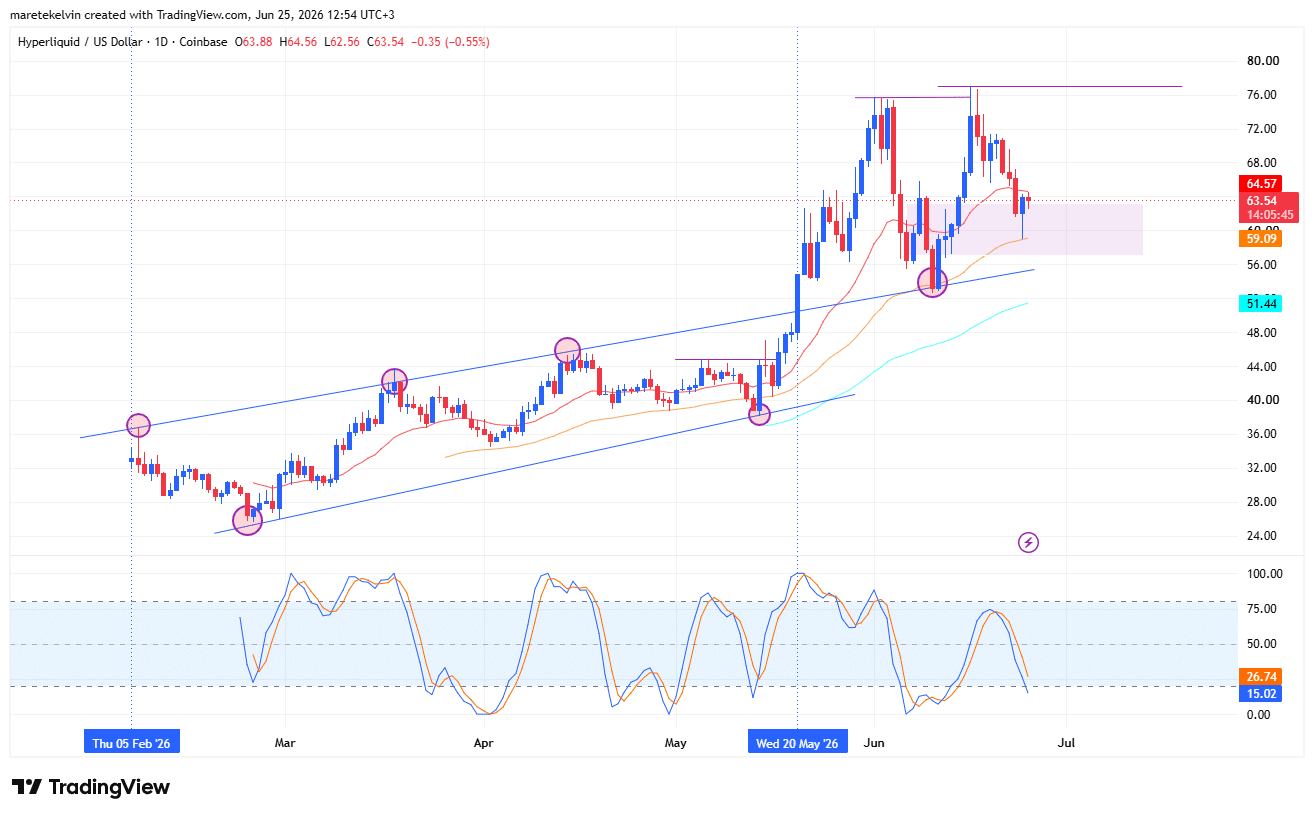
Hyperliquid [HYPE] has been consolidating on an ascending triangle pattern since its debut on Coinbase back on the 5th of February.
The token managed to break out back on the 20th of May and rallied explosively to $75 before retracing and bouncing off explosively from the triangle support at $53. As a result, it left behind a market imbalance between $57 and $63.
As of this writing, HYPE was testing the imbalance zone after an aggressive correction. This occurred since it swept the liquidity at the $75 resistance level. The token is now building some bullish momentum, with the next target in line being the $77 resistance zone.
Why are traders watching $77?
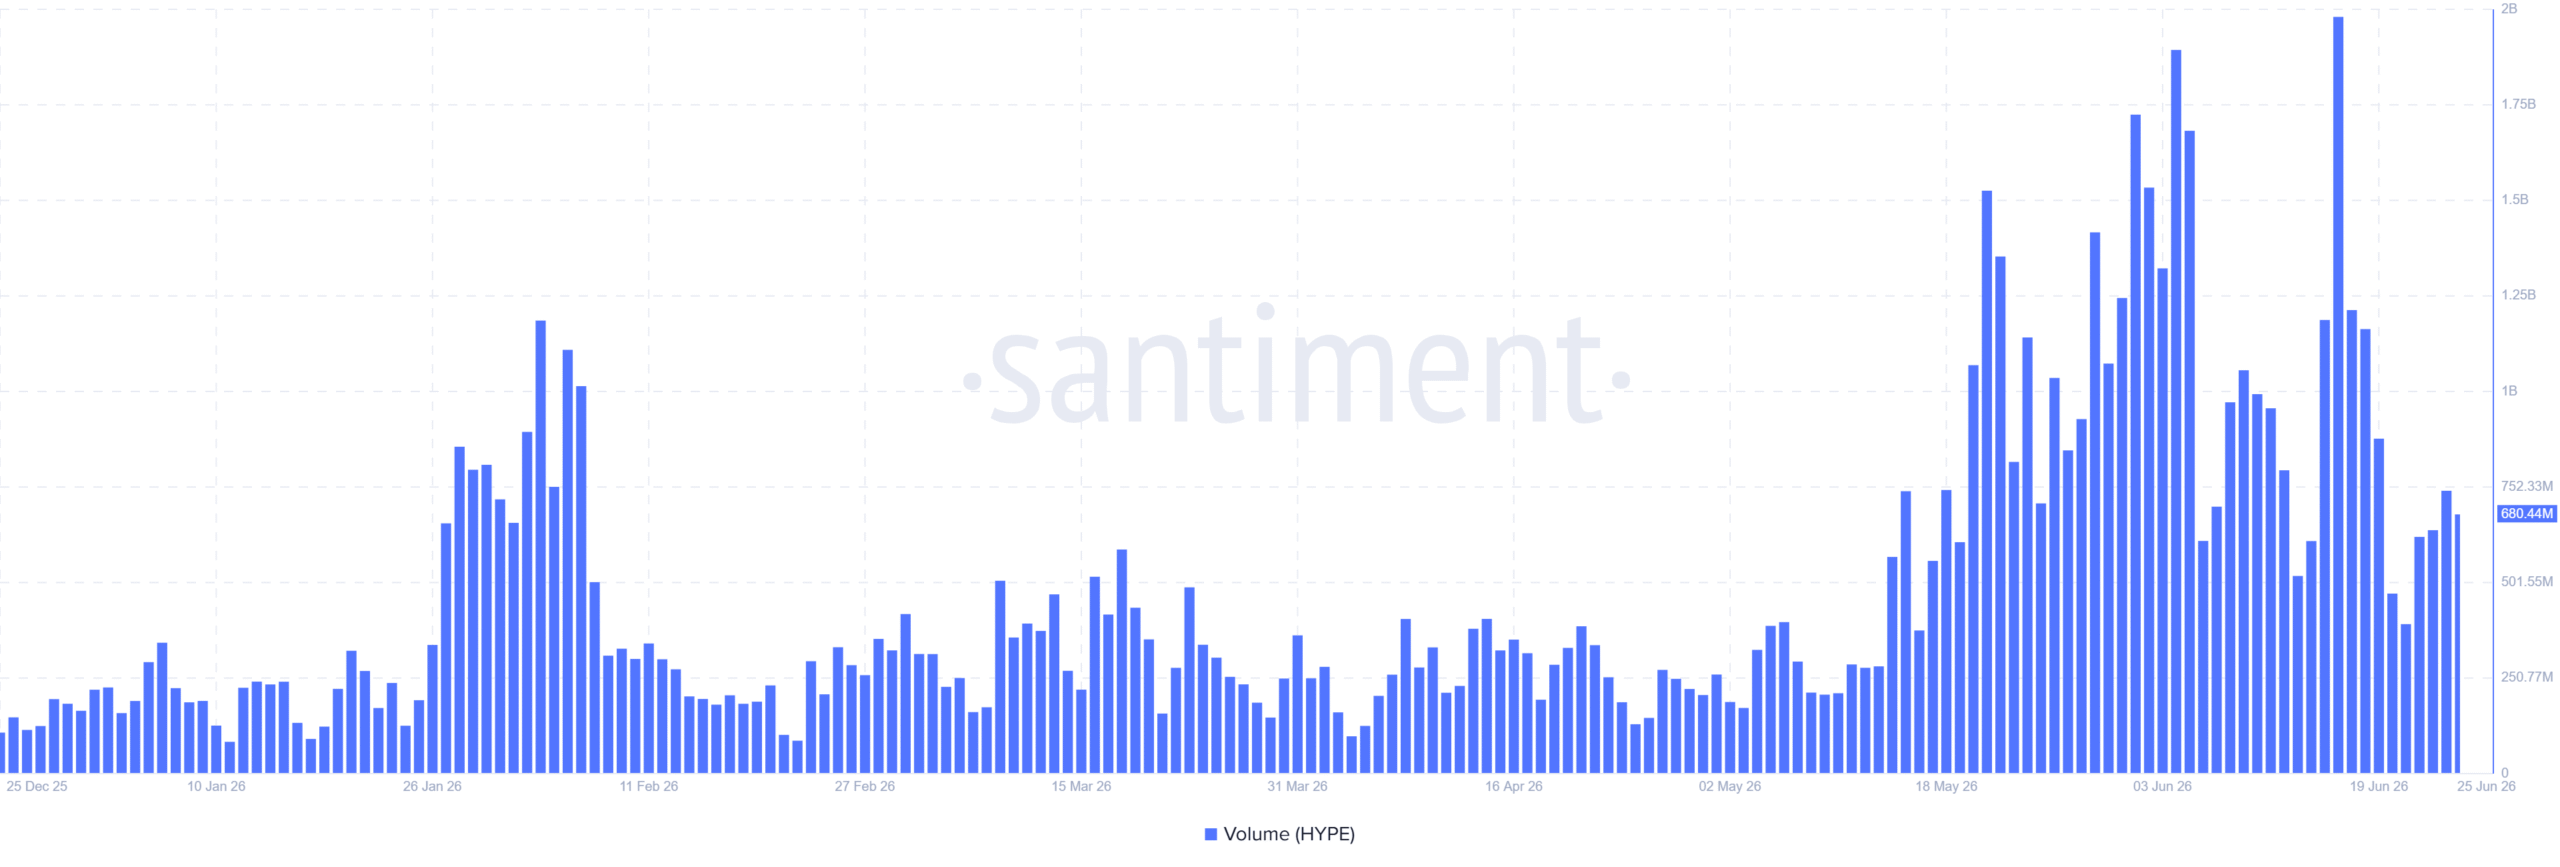
The Hyperliquid network’s trading activity is notably aligning with HYPE’s bullish technical structure.
Trading volume has made a significant surge over the last four days, highlighting that investors were taking on more long positions to capitalize on the projected surge back to the point of liquidity at $77.
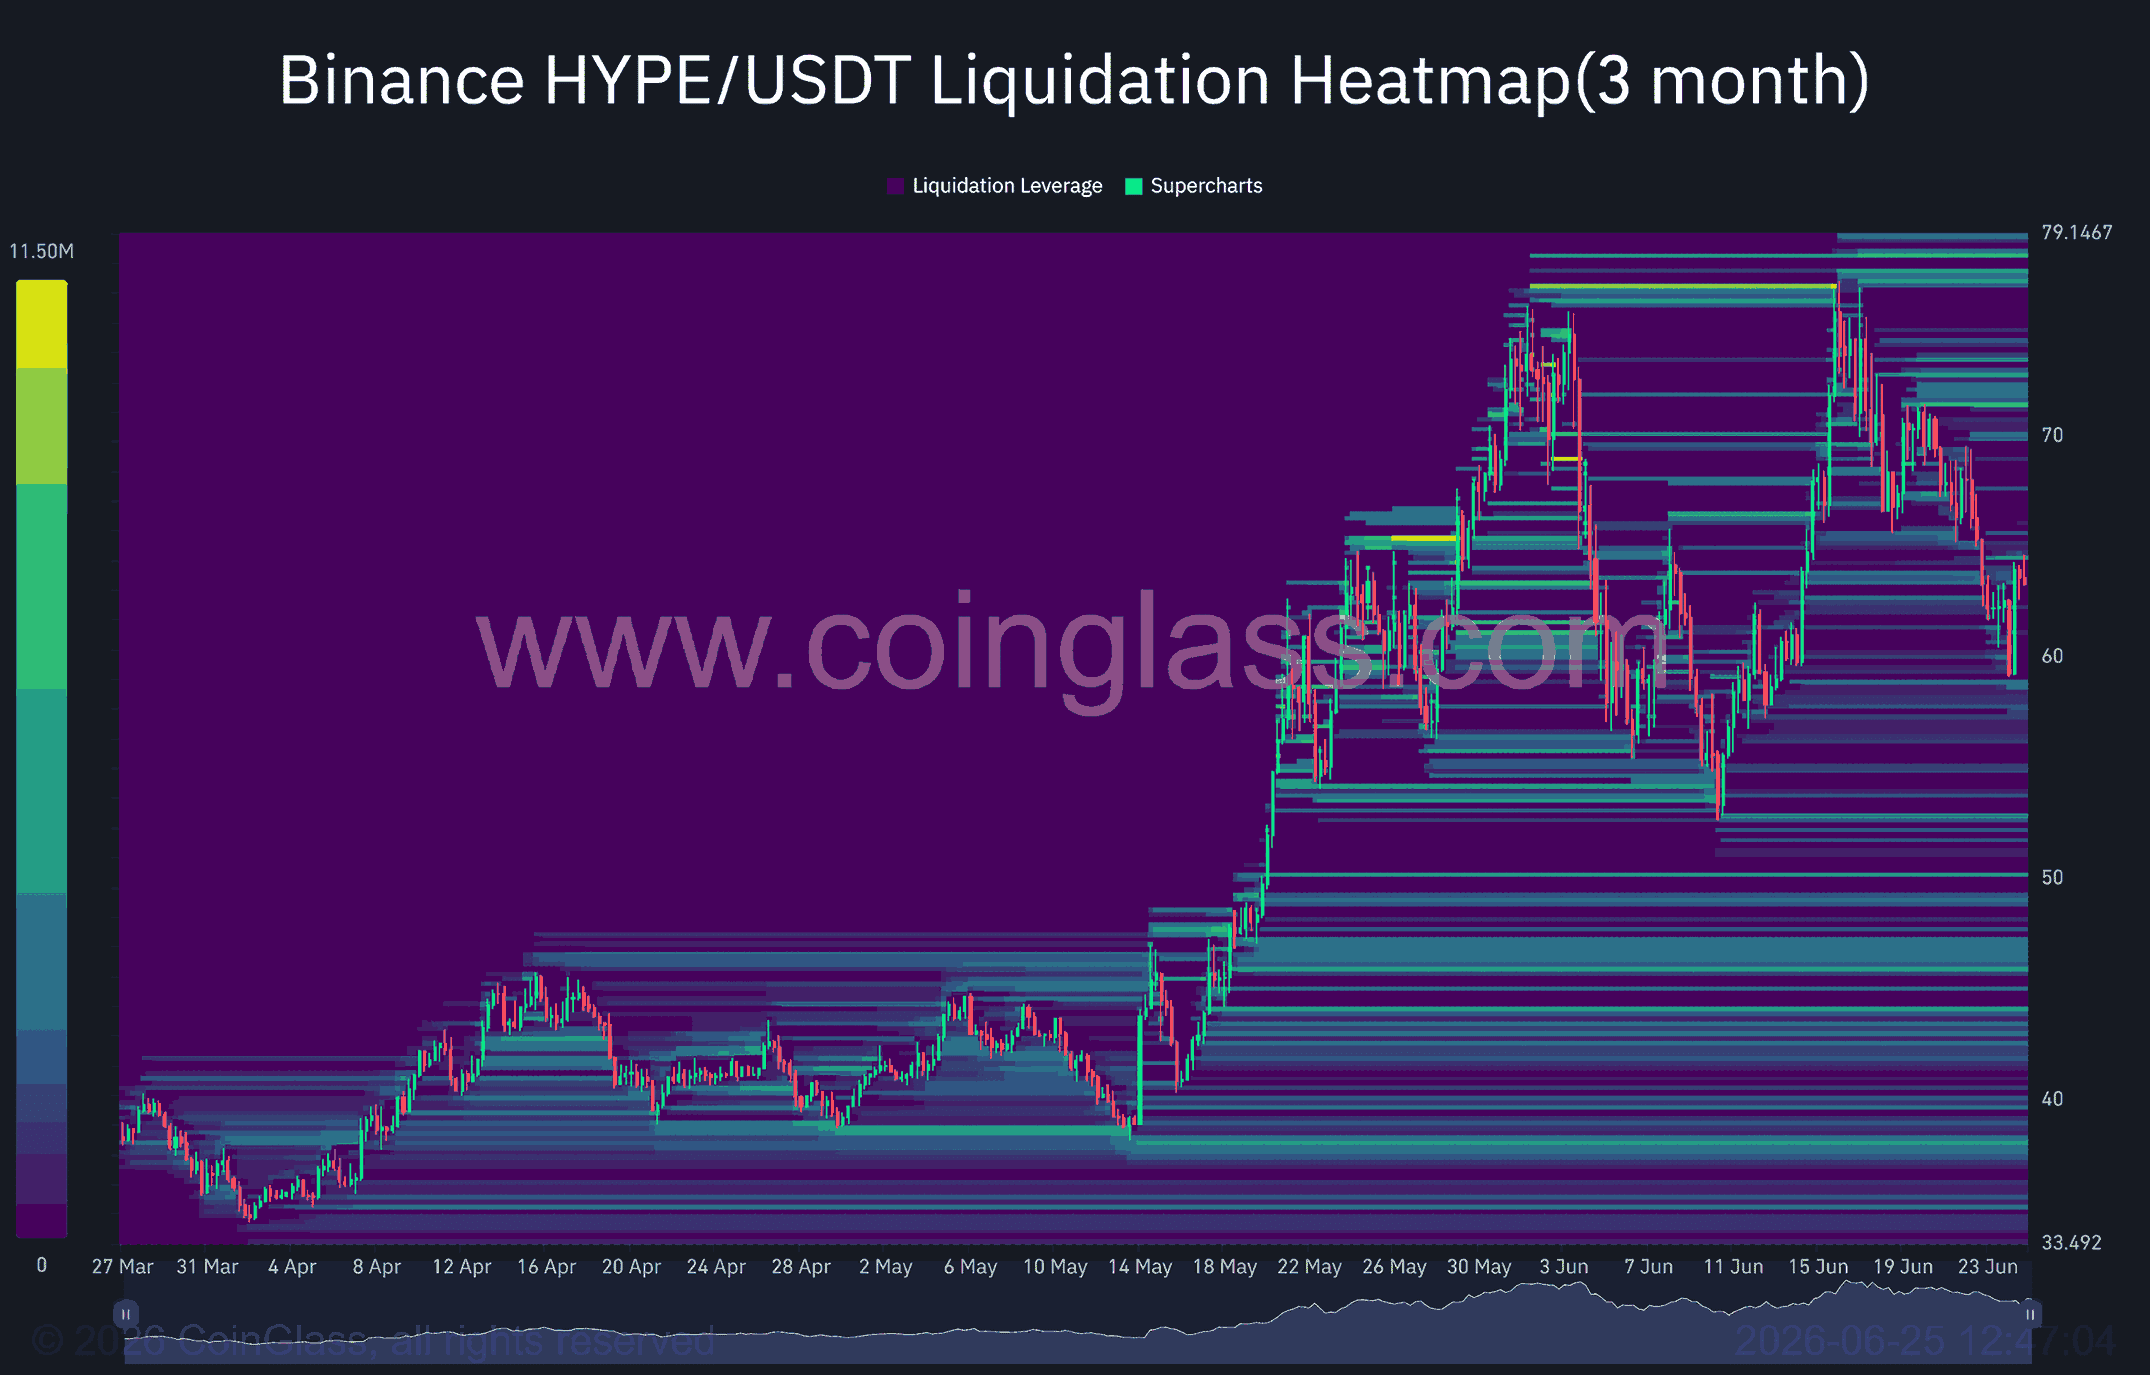
Liquidity cluster at $77 affirms it as a key target
Zooming down to HYPE’s liquidation heatmap data, several significant liquidity clusters summing to $10 million rest at around $77 resistance. These clusters support the price level as a crucial point of reference for a bullish outlook.
In most cases, the liquidity clusters act as price action magnets upon which prices oscillate around. For HYPE, the same scenario could come into play.
Buyers and investors have already started accumulating more positions to target the unmitigated liquidation resting at the resistance level as depicted by the surging trading volume.
Will HYPE’s bullish structure hold?
All technical indicators are aligning to HYPE’s bullish bias.
HYPE is trading above key Exponential Moving Averages (EMAs), increasing the likelihood of a potential bullish run continuation.
At the same time, the token’s stochastic RSI is just bouncing off from an oversold region. This action affirms the current imbalance zone as a key turning point for a potential price reversal.
Final Summary
- HYPE is rebounding from a key market imbalance after defending ascending triangle support, keeping the broader bullish structure intact.
- Rising trading volume and a $10 million liquidity cluster near $77 are drawing traders’ attention to the next potential resistance zone.

![Assessing Sonic's [S] 12% price drop and why more selling may be next](https://ambcrypto.com/wp-content/uploads/2026/06/IMG_3686-e1782398976520.webp)