HYPE’s path forward – Can it break the $16 resistance?

- Hyperliquid traders should be cautious of FOMO, even though short-term momentum was bullish.
- The $15-$16 region could prove to be a key resistance zone for HYPE.
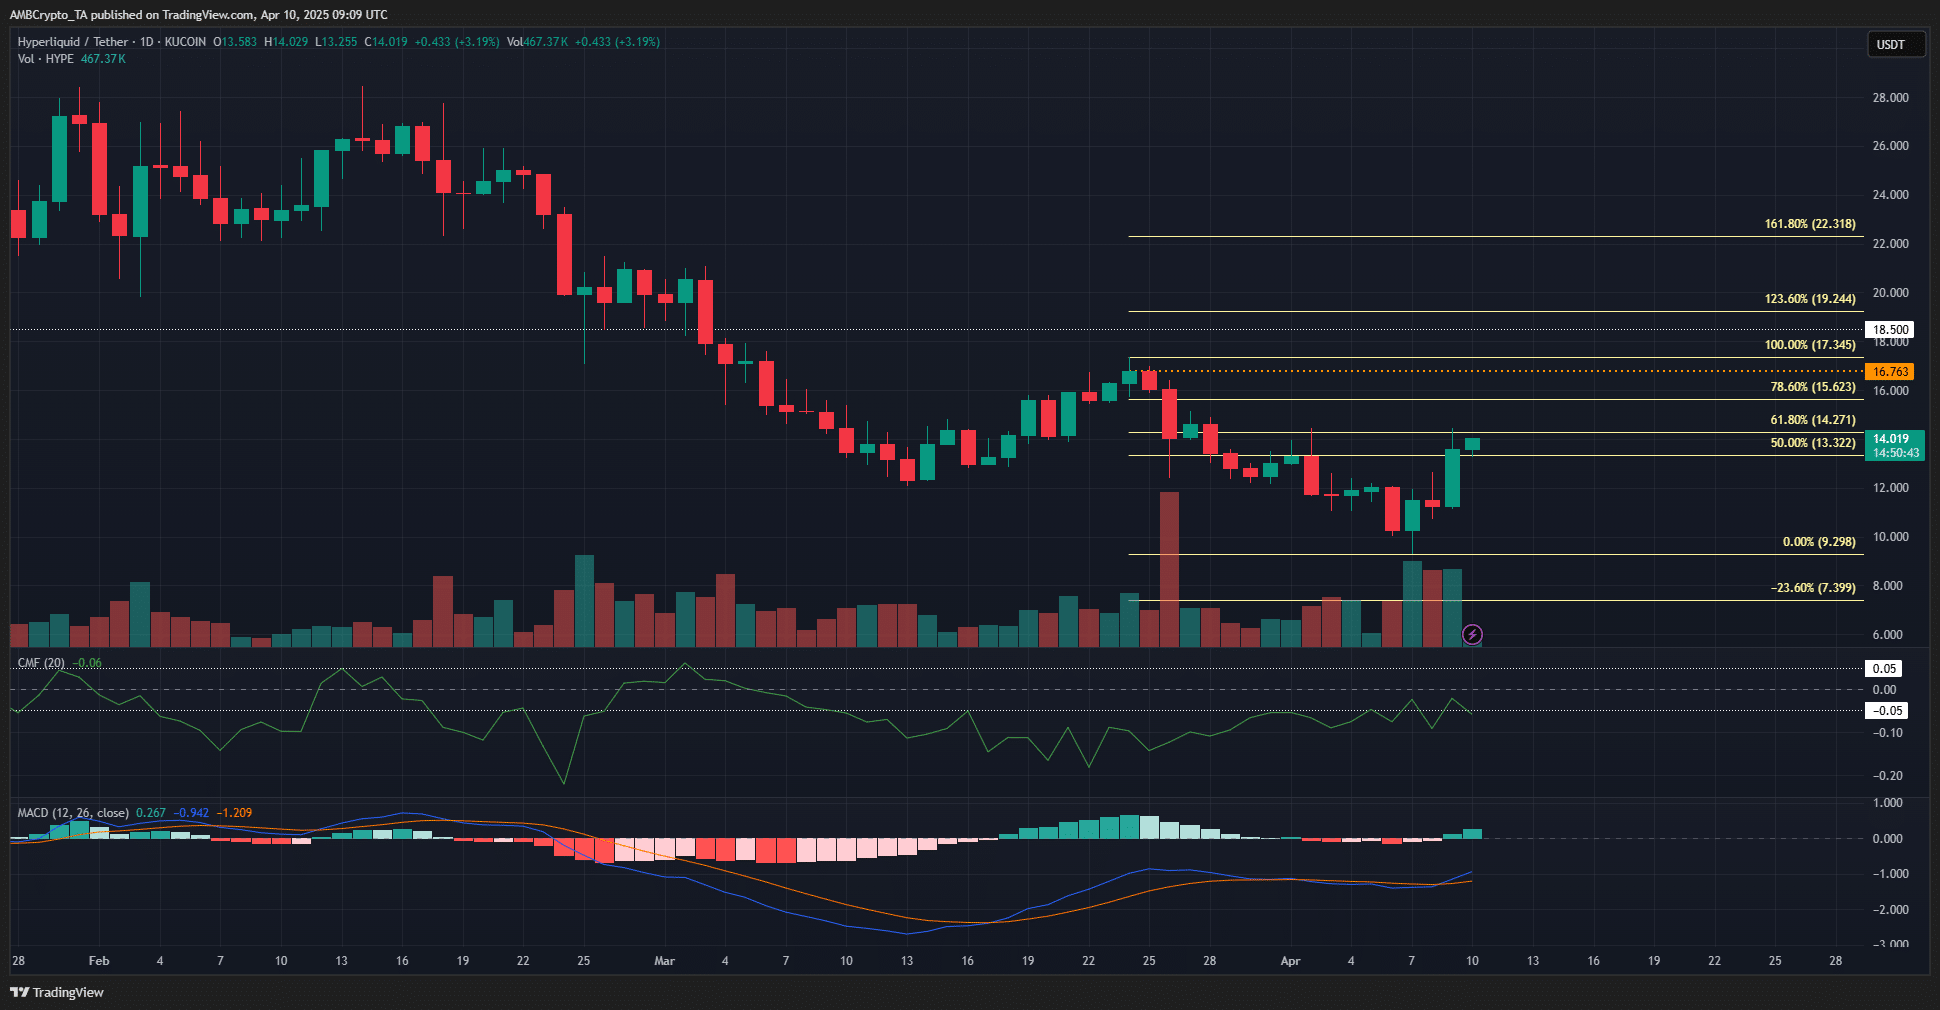
The downtrend of Hyperliquid [HYPE] has not halted, even though the price has jumped by 50.8% since the lows on the 7th of April. To shift the structure bullishly, the price must climb above the recent lower high at $16.76.
The short-term upward momentum and buying pressure could help achieve this outcome. Bitcoin [BTC] has also moved beyond $80k and could push higher if the market sentiment can remain positive in the short term.
HYPE investors cautiously optimistic despite market conditions
Based on the recent drop from $17.34 to $9.29, a set of Fibonacci retracement levels were plotted. They marked the $14.27 and $15.62 levels as the key retracement levels for the bulls to breach.
The CMF on the daily chart floated just below the -0.05 level to indicate heavy capital outflow. The MACD was also well below the zero line, though there was a bullish crossover between the MACD line and the signal line.
Together, the indicators pointed toward weak bullishness and prevalent selling pressure. A recovery was not likely in these conditions.
However, the situation was different on the lower timeframe. The 4-hour chart showed a bullish market structure after Hyperliquid token prices surged beyond $11.46 on the 8th of April.
At the same time, the CMF signaled sizable buying pressure, and the MACD showed strong upward momentum.
If this performance can continue, the Fibonacci retracement levels overhead might not be unassailable. With that said, since the higher timeframe was bearish, traders and investors can be cautiously optimistic.
A swing buy opportunity can open up once the $15.6 level is flipped from resistance to support.

Source: Coinglass
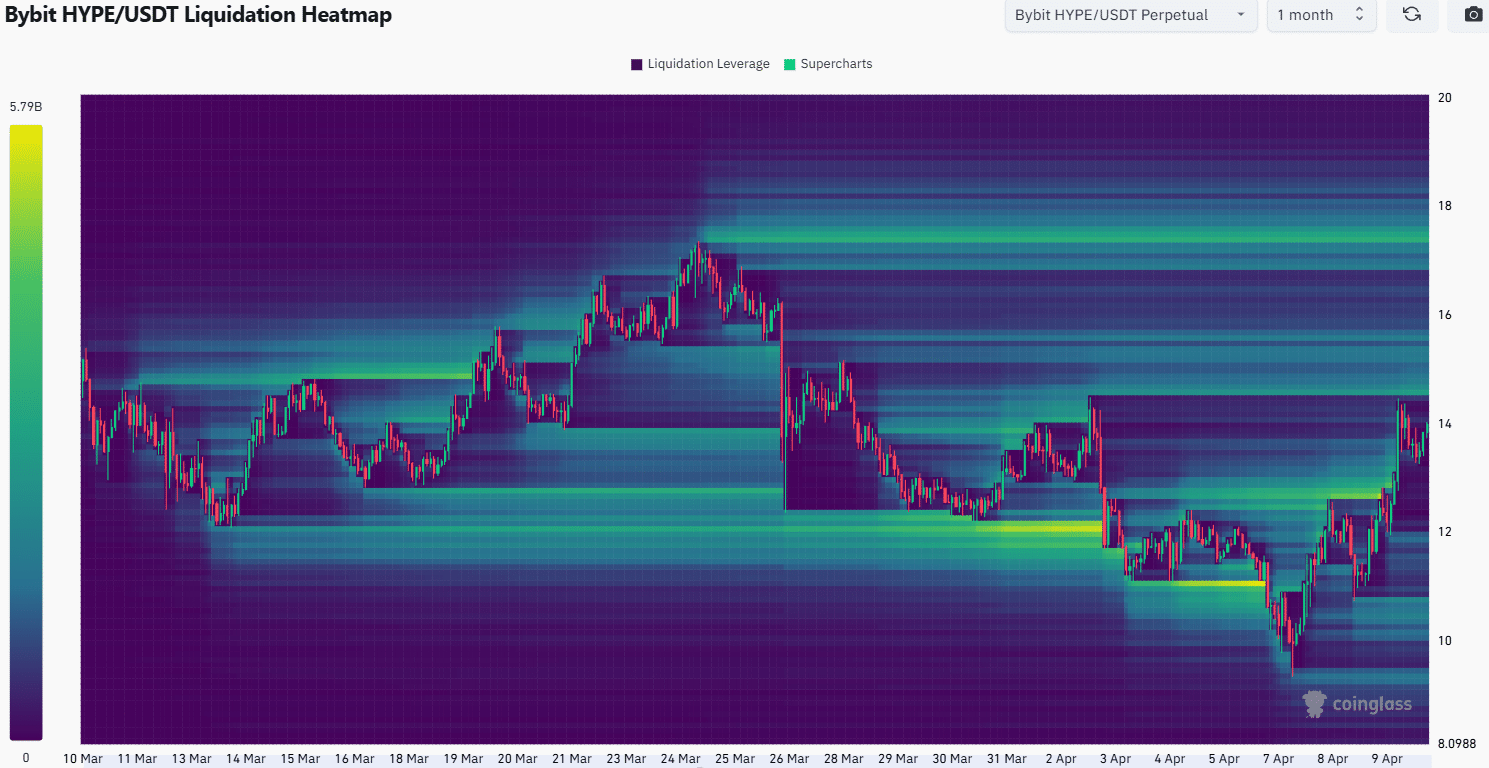
The 1-month liquidation heatmap marked the $14.6-$15.7 region as a magnetic zone, with the former being the stronger one. This meant that a price move to $14.6 was highly likely in the short term.
Thereafter, expectations should be dependent on Bitcoin and the wider market sentiment. As things stand, a move beyond the $15-$16 region could be difficult due to the trend on the 1-day chart.
To the south, the $12 level saw a large amount of liquidations build up over the past three days. Hence, it would be the target in the event of the 4-hour trend changes.
Disclaimer: The information presented does not constitute financial, investment, trading, or other types of advice and is solely the writer’s opinion


