
- BlackRock’s IBIT experienced a remarkable half-a-billion inflow, and record demand has caused IBIT stock to soar 20% in two weeks.
- If BTC fails to sustain the $66,200 crucial demand zone, we may see a price drop to the $64,000 level.
Following the approval of the spot Ethereum [ETH] Exchange-Traded Fund (ETF) in the United States, the overall cryptocurrency market turned red and experienced selling pressure.
Despite this ongoing selling pressure, Bitcoin [BTC] ETF has experienced a massive inflow of over $534 million, according to the data shared by an on-chain analytic firm Spotonchain.
BlackRock’s IBIT total inflows near $20 billion
With this, Bitcoin ETF inflow has remained positive for the last 12 consecutive trading days.
In this record inflow, BlackRock’s iShares Bitcoin Trust (IBIT) has gained massive attention as it experienced a remarkable half-a-billion inflow.
This is the first time since the 13th of March that IBIT has experienced such a notable inflow.
With this record inflow, the total inflow for IBIT since its launch has crossed $19.5 billion. Additionally, the IBIT holdings have also soared to 325,000 BTC worth $22.5 billion, and its stock price jumped by 2.56%.
If we look at the performance of IBIT, over the last two trading weeks, it has noted a price jump of over 20%. Whereas in the last 30 days, following increased interest from investors and traders, IBIT saw a price surge of over 15%.
Apart from BlackRock’s IBIT, the asset manager giant VanEck (HODL) saw an outflow of over $38.4 million, marking the largest single-day outflow since the ETF’s inception.
Meanwhile, Grayscale’s GBTC experienced a $0 inflow.
Bitcoin technical analysis and upcoming levels
According to expert technical analysis, Bitcoin remained bullish and was at a crucial demand zone of $66,200 at press time. In a 4-hour time frame, BTC has visited this demand zone multiple times since the 19th of July.
The continuous price retest to the $66,200 level could weaken this demand zone. If BTC fails to sustain and breaks down from this level, we may see a price drop to $64,000 in the coming days.
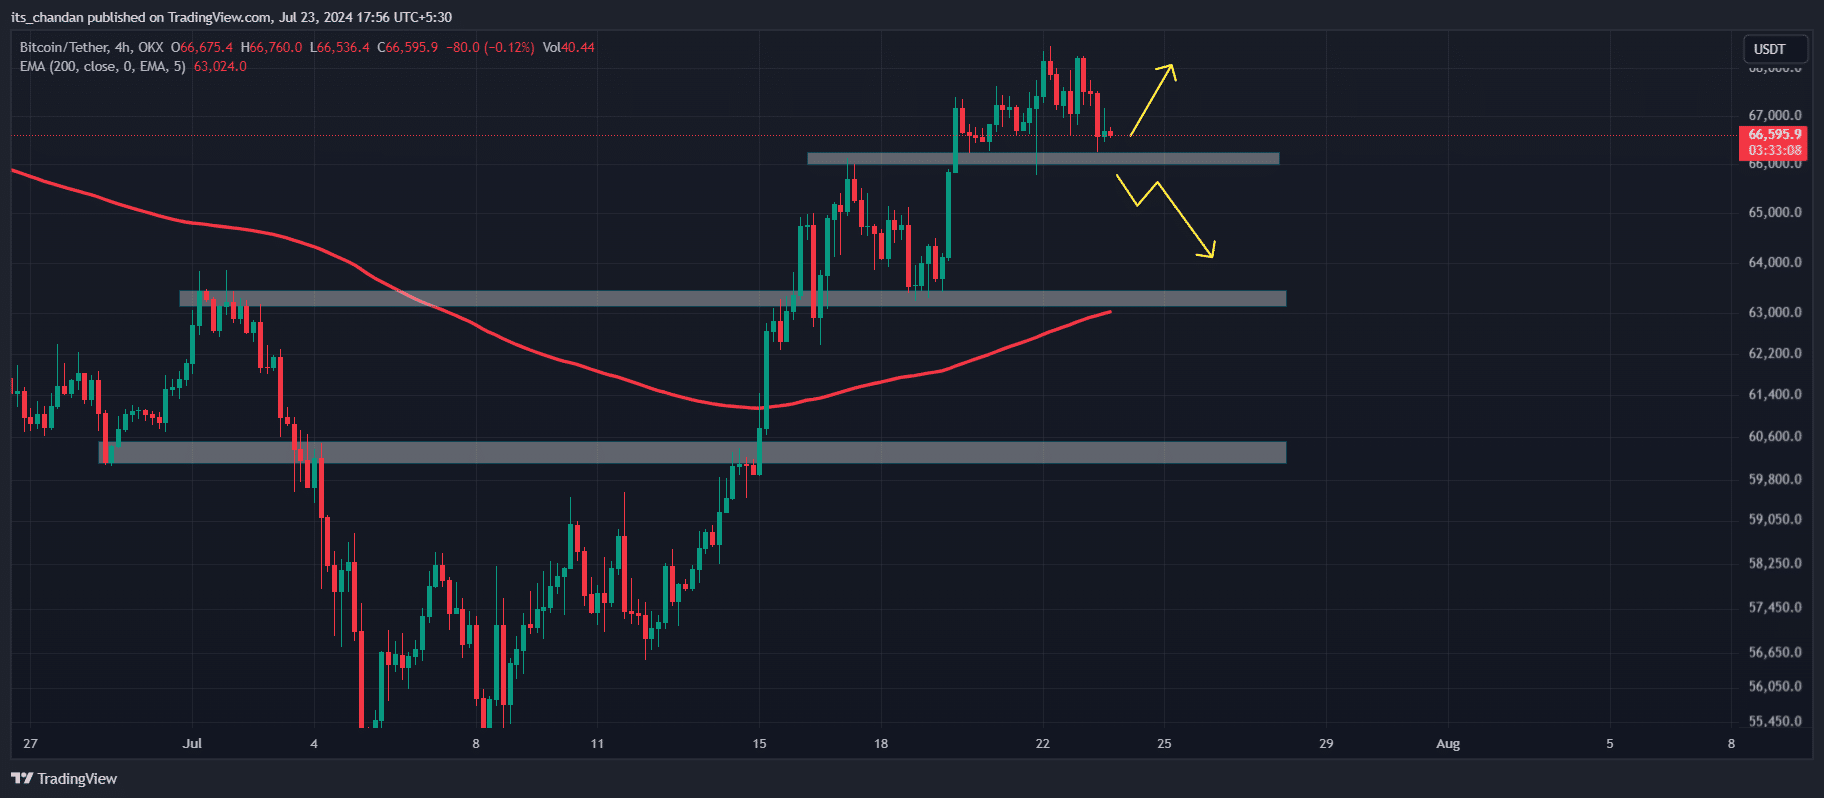
Source: TradingView
Additionally, BTC was still above 200 Exponential Moving Average (EMA) in both the daily and 4-hour time frames. The price of any assets above 200 EMA indicated bullishness in the chart.
Is your portfolio green? Check out the BTC Profit Calculator
As of this writing, BTC was trading near the $66,700 level and has experienced a price drop of over 1.5% in the last 24 hours.
Despite the price drop, investor and trader participation has risen by 45% signaling their interest. Whereas, BTC has gained 4.7% in value over the last 30 days.


![Polygon's [POL] short-term momentum faces strong resistance HERE](https://ambcrypto.com/wp-content/uploads/2025/03/Polygon-Featured-400x240.webp)