Identifying how and why XRP could see losses of another 10%

Disclaimer: The information presented does not constitute financial, investment, trading, or other types of advice and is solely the writer’s opinion.
- The lower timeframe structure favored the bears
- XRP bulls can exercise caution and patience
XRP saw red on the price charts once again after falling beneath an important level of support on Saturday. This could pave the way for further losses. Although the longer-term price action saw the asset trade within a range over the past four months, lower timeframe momentum could swing in favor of the sellers.
Is your portfolio green? Check the XRP Profit Calculator
Bitcoin remained stationary on the charts as well and could hurt both buyers and sellers if they try to position themselves too early. The king of crypto has support at $21.6k, and a dip to these levels could see sentiment begin to shift across the market.
The mid-range level was flipped to resistance but the sell volume was low
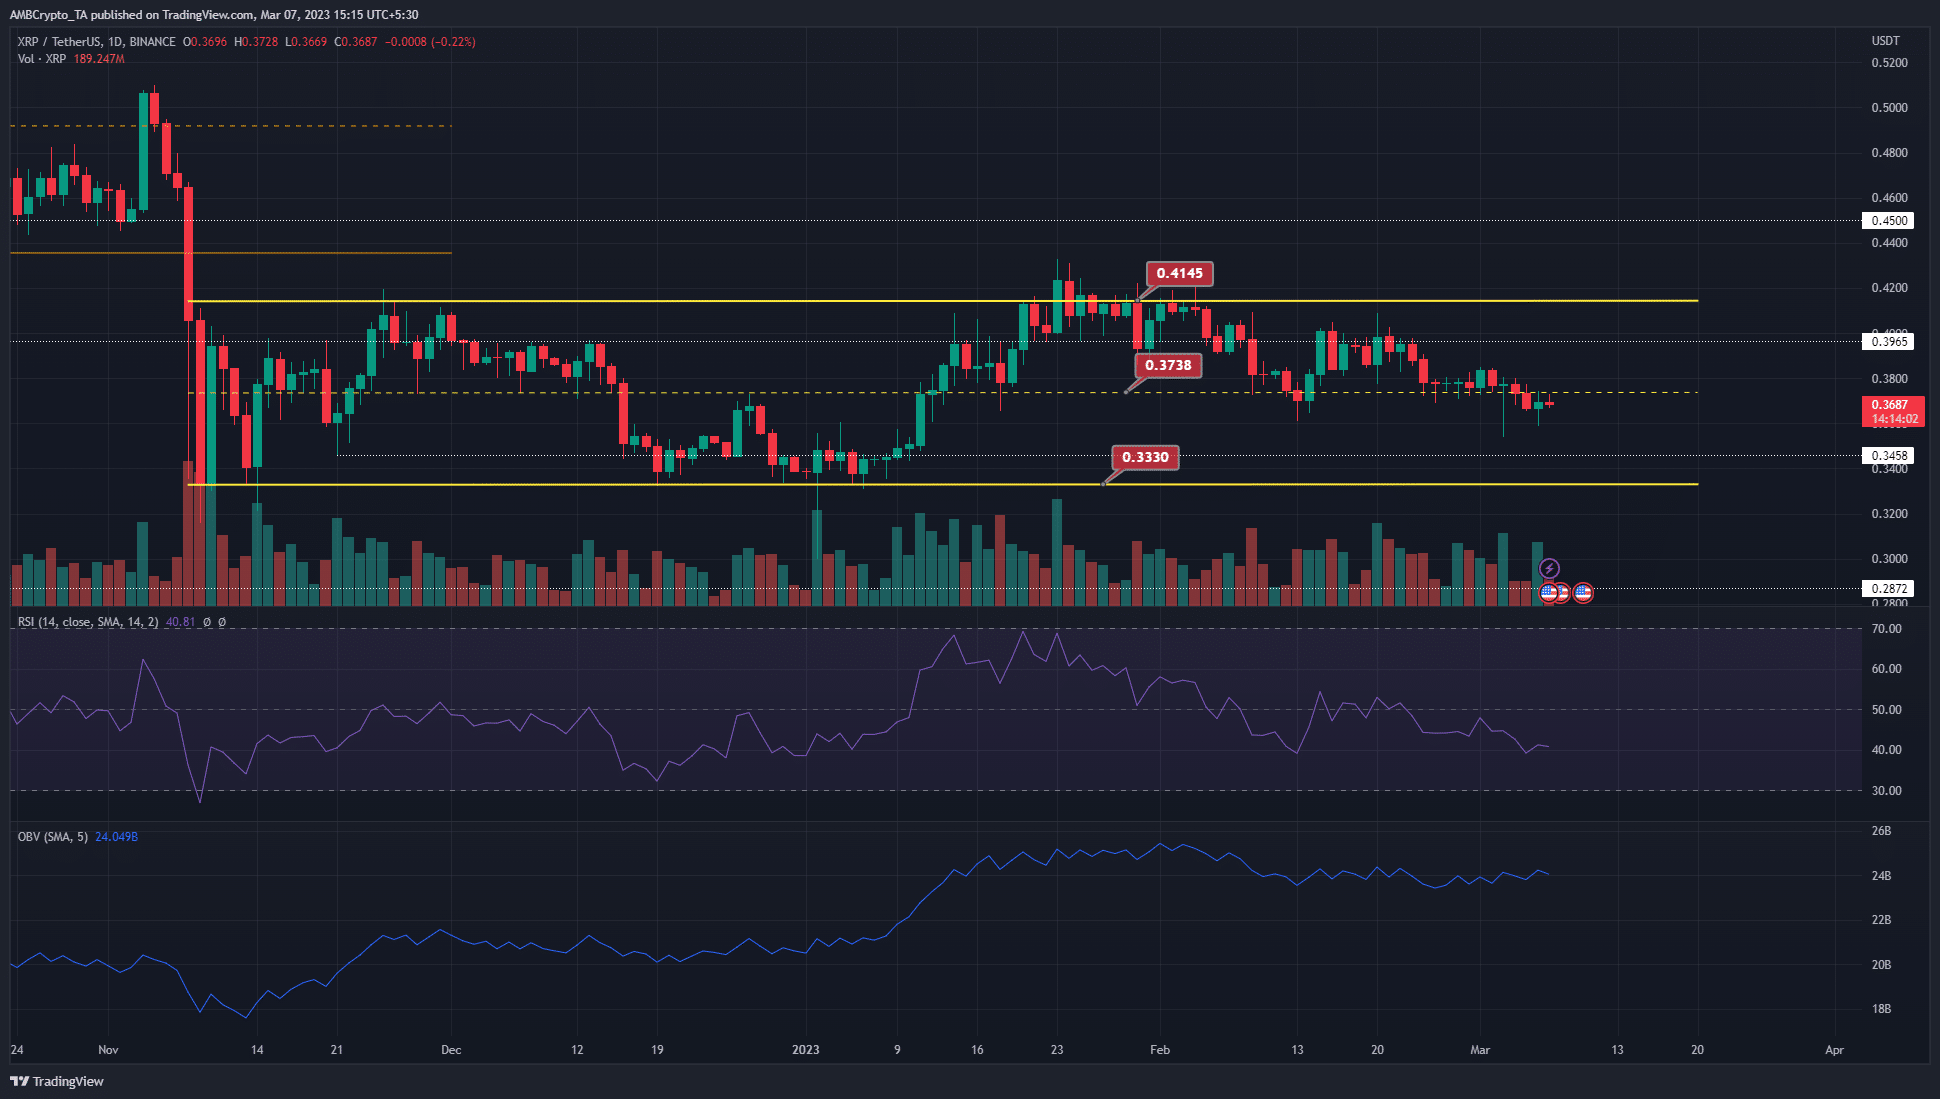
XRP has traded within a range from $0.33 to $0.415 since November. The mid-range mark sat at $0.37 and served as support in late February. Eventually, a daily session closed beneath this level, signifying a flip from support to resistance.
The trading volume has been steady but the OBV showed that neither buyers nor sellers have had the upper hand since mid-February. This, in contrast to the strong uptrend on the OBV in early January. Since the price traded within a range, no strong long-term trend was expected until a breakout past either extreme.
In the meantime, the fall beneath the mid-range highlighted further losses were likely. Moreover, the RSI also dropped below the neutral-50 mark to indicate bearish momentum.
Realistic or not, here’s XRP’s market cap in BTC’s terms
A bullish order block resided in the $0.36-$0.375 area, but XRP has already ventured under this zone in recent weeks. Therefore, a move to the range lows can be expected.
The mean coin age highlighted strong sell pressure
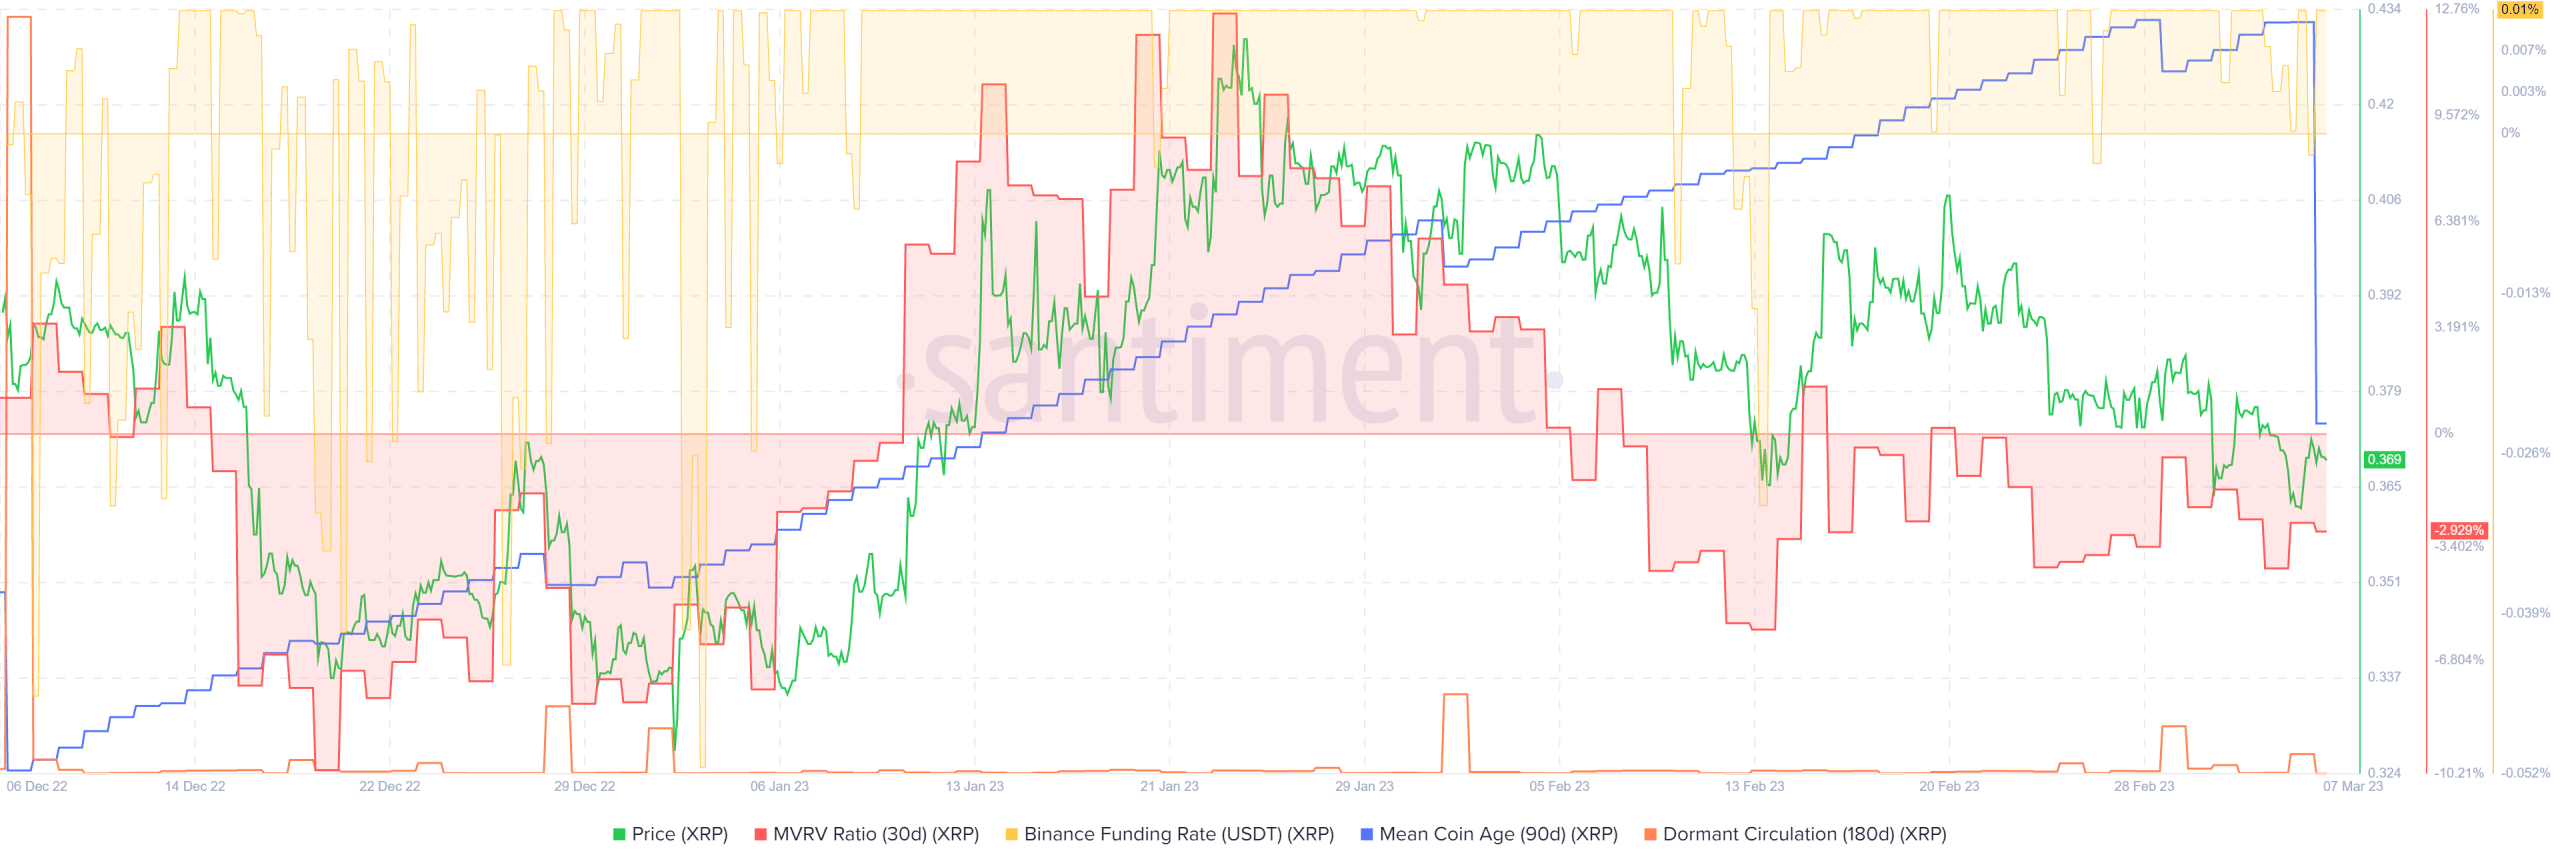
The 30-day MVRV ratio noted that short-term holders were not profiting over the past month. Hence, a huge wave of selling due to profit-taking might not be upon us, but selling pressure seemed imminent.
The significant drop in the mean coin age metric highlighted a large number of tokens were transferred within addresses and could presage another nuke on the price charts. The funding rate remained positive, but buyers can look to remain cautious. The 180-day dormant circulation remained relatively flat – A sign that longer-term holders have not been active lately.