Identifying if LINK is a good long-term bet for your portfolio

- Whales desisted from making large LINK transactions
- Number of holders rose, pointing to a bullish thesis this cycle
Large transactions involving Chainlink [LINK] have fallen by 23.55% in the last seven days, according to AMBCrypto’s findings. In fact, these transactions amounted to $70.32 million.
The decrease in these transactions means that the those armed with enough capital have been overlooking the token. If LINK fails to get the attention of these whales, and enjoy some accumulation, the price might suffer for it.
A decline may not be bad
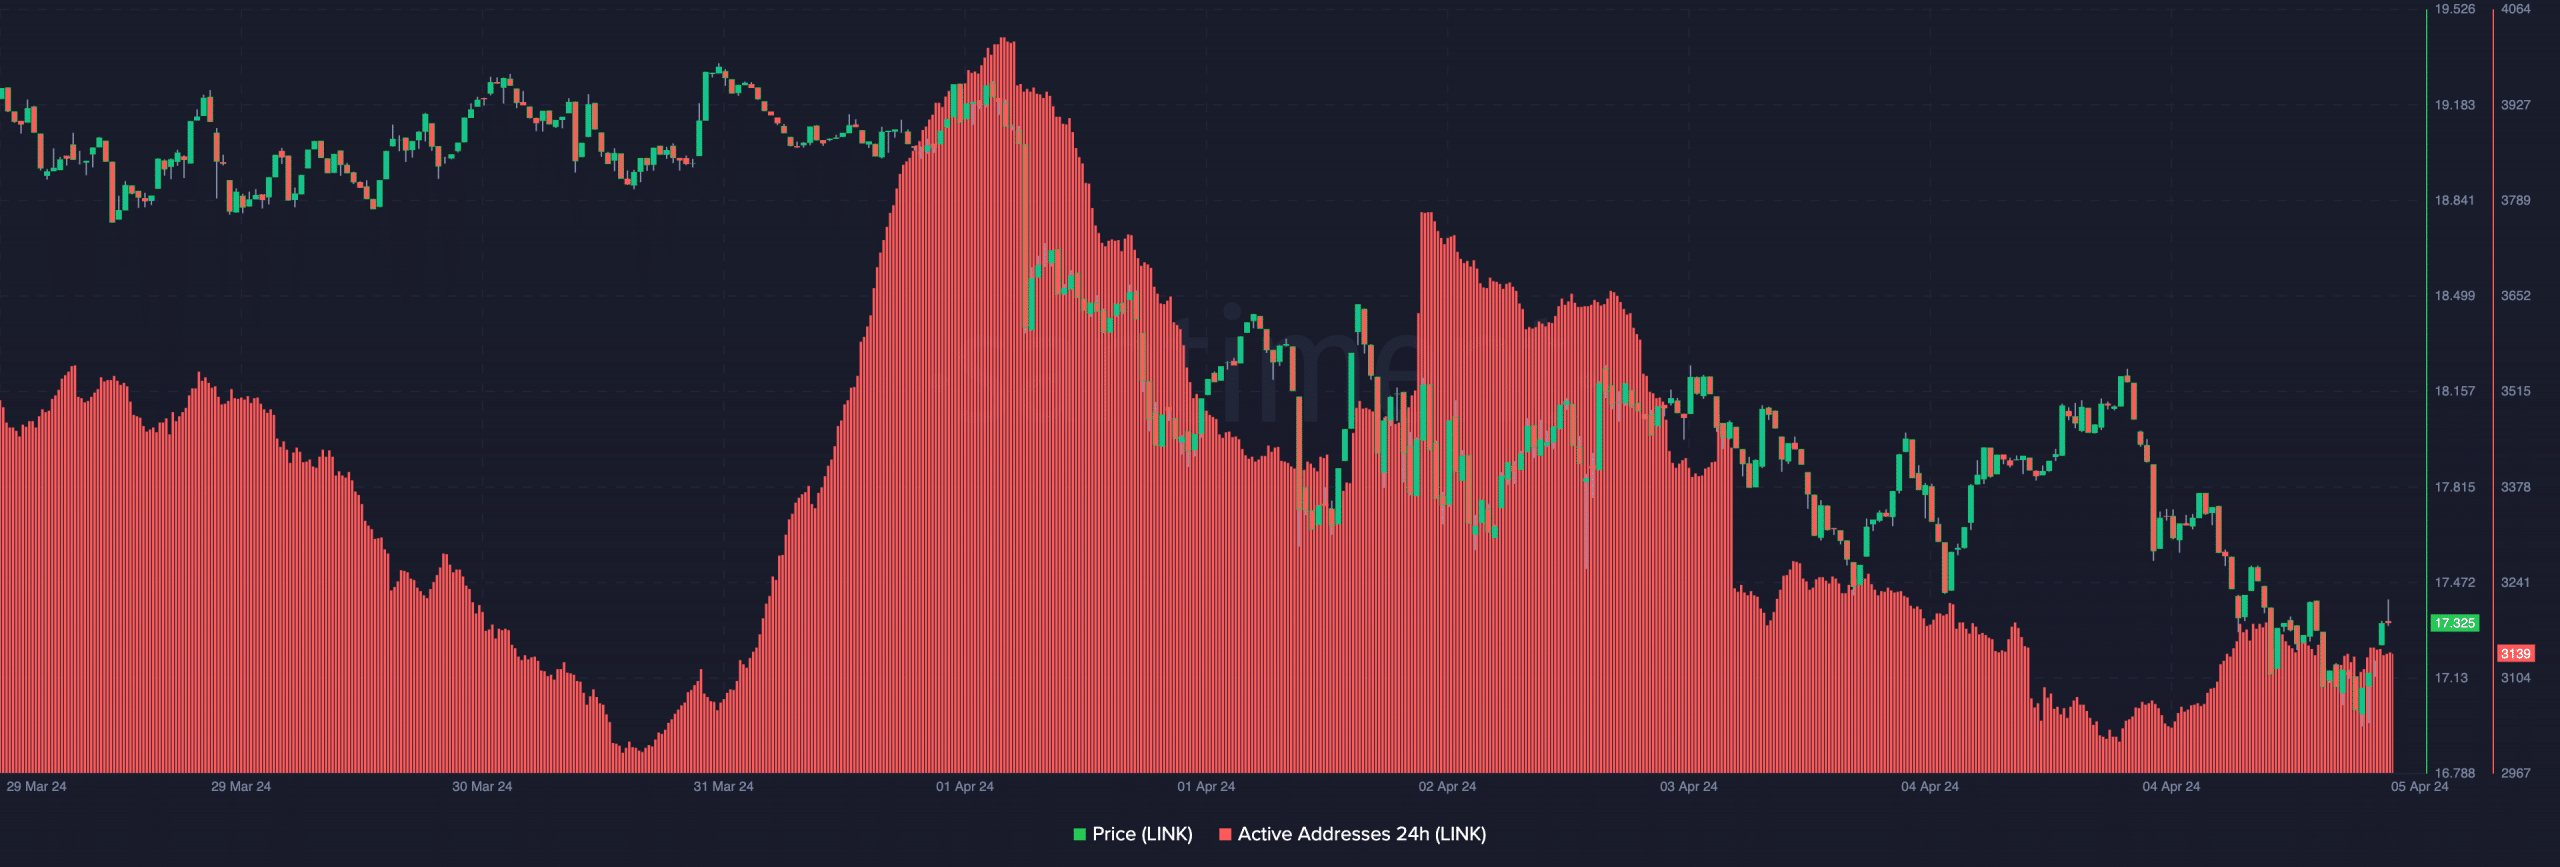
At the time of writing, LINK was valued at $17.32 — A 9.58% decline in the last 7 days. However, the price was not the only metric that fell within the past week.
In fact, on-chain data from Santiment revealed that active addresses also fell. On 1 April, the 24-hour active addresses on Chainlink were over 4000, suggesting that interaction was impressive. However, the same metric had a reading of 3139 at press time. This decline implied that the number of unique addresses involved in LINK transactions decreased.
For the price action, this could be a bearish sign. On the contrary, at the same time, this puts LINK in a critical spot. Traders who have followed the token’s historical performance would agree that a fall in network activity could serve as a local bottom.
However, this does not happen all the time. Even so, with the kind of correction Chainlink has gone through, the chances of a bounce might be higher. Ergo, the question – What signals are other metrics flashing?
To play the long-term game?
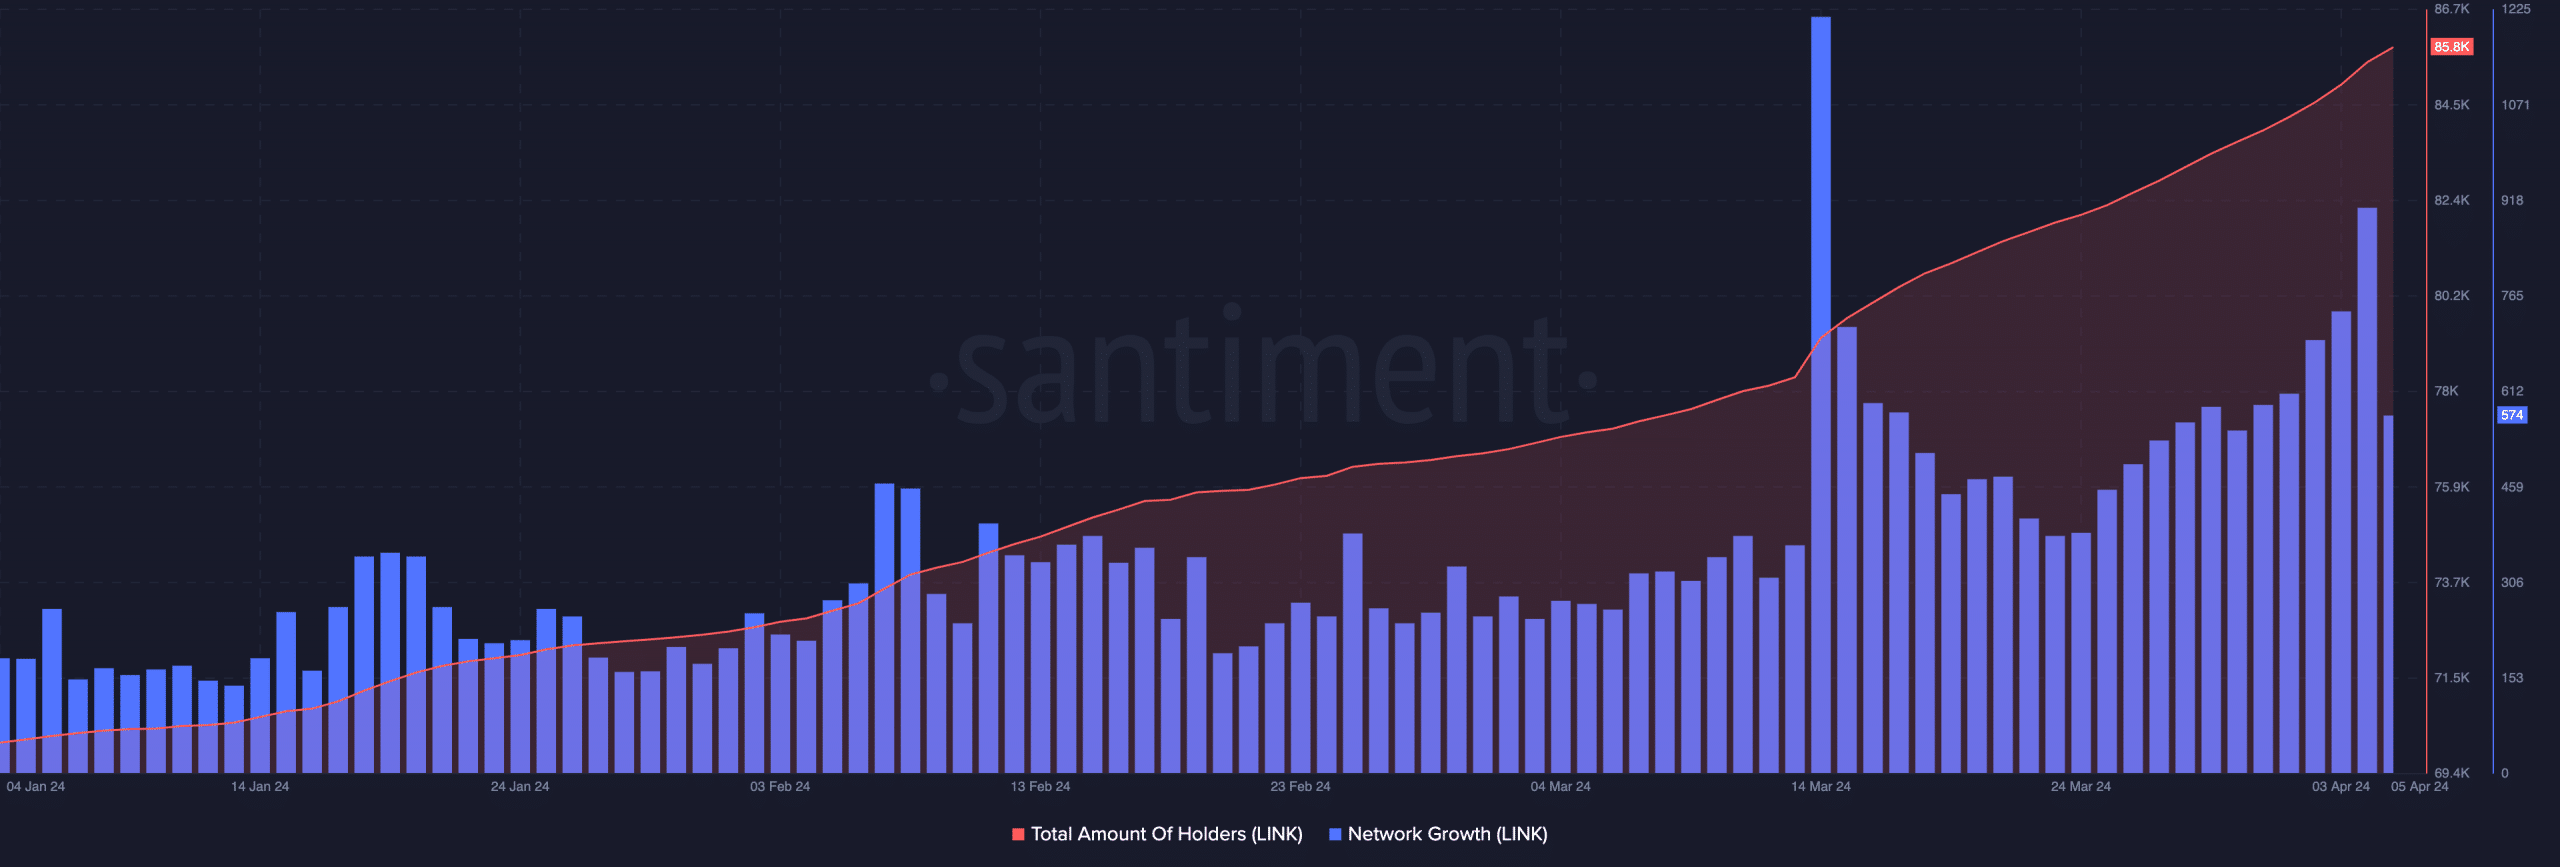
AMBCrypto looked at the number of holders too. On 13 March, LINK had less than 80,000 holders. At press time though, the total amount of holders had risen to 85,800.
A situation like this suggests that many market participants trust in the long-term potential of the cryptocurrency. However, that does not imply that LINK would evade another round of correction.
While it might, the price in the long term, if the holder count rises, might be higher than the value mentioned above. In terms of network growth, Santiment’s data showed that there was a change too. For instance, Chainlink’s network growth tanked on 24 March. On 4 April though, the metric jumped, indicating that new addresses have been performing transactions on the network.
Though the number only slightly decreased, the initial jump can be seen as a sign of increased adoption. If traction on the network increases, then demand for LINK will also jump.
From a trader’s perspective, LINK seems to offer a good long-term breakout. On the other hand, the short-term outlook might not offer much in terms of gains.
Is your portfolio green? Check the Chainlink Profit Calculator
In the meantime, the value of LINK might move sideways for some days. However, if a further correction happens, buying pressure could drive the price higher later on.


![Solana [SOL] gains on Ethereum [ETH] but faces sell-off risks](https://ambcrypto.com/wp-content/uploads/2025/04/5B92B32E-5F8B-49F6-94A3-D0086EF6CCA2-400x240.webp)


