In a market of extreme fear, when will a Bitcoin entry make sense
After its $69,000 all-time high, Bitcoin’s price has been on a downtrend for the most part of the last month. On 4 November, after the king coin registered the strongest bearish candle since May on a daily chart, the shake-off left the market shaken.
While the quick rebound from the near $40k-level, up towards the $48k-mark, instilled some confidence among market participants, the larger sentiment still remained bearish. Especially as BTC oscillated close to $47,969 at press time.
The larger sell-offs led the Crypto Fear and Greed Index to once again dip into the extreme fear territory as Bitcoin traded below the 100-hour Simple Moving Averages. Bitcoin’s weekly close, which has been key to the bullish trajectory and the mid-short term price action, closed just above the $51k-mark.
However, looking at a more short-term perspective, a key bullish trend line formed with the support near $48,500 on the smaller timeframe.
So, where does the market stand?
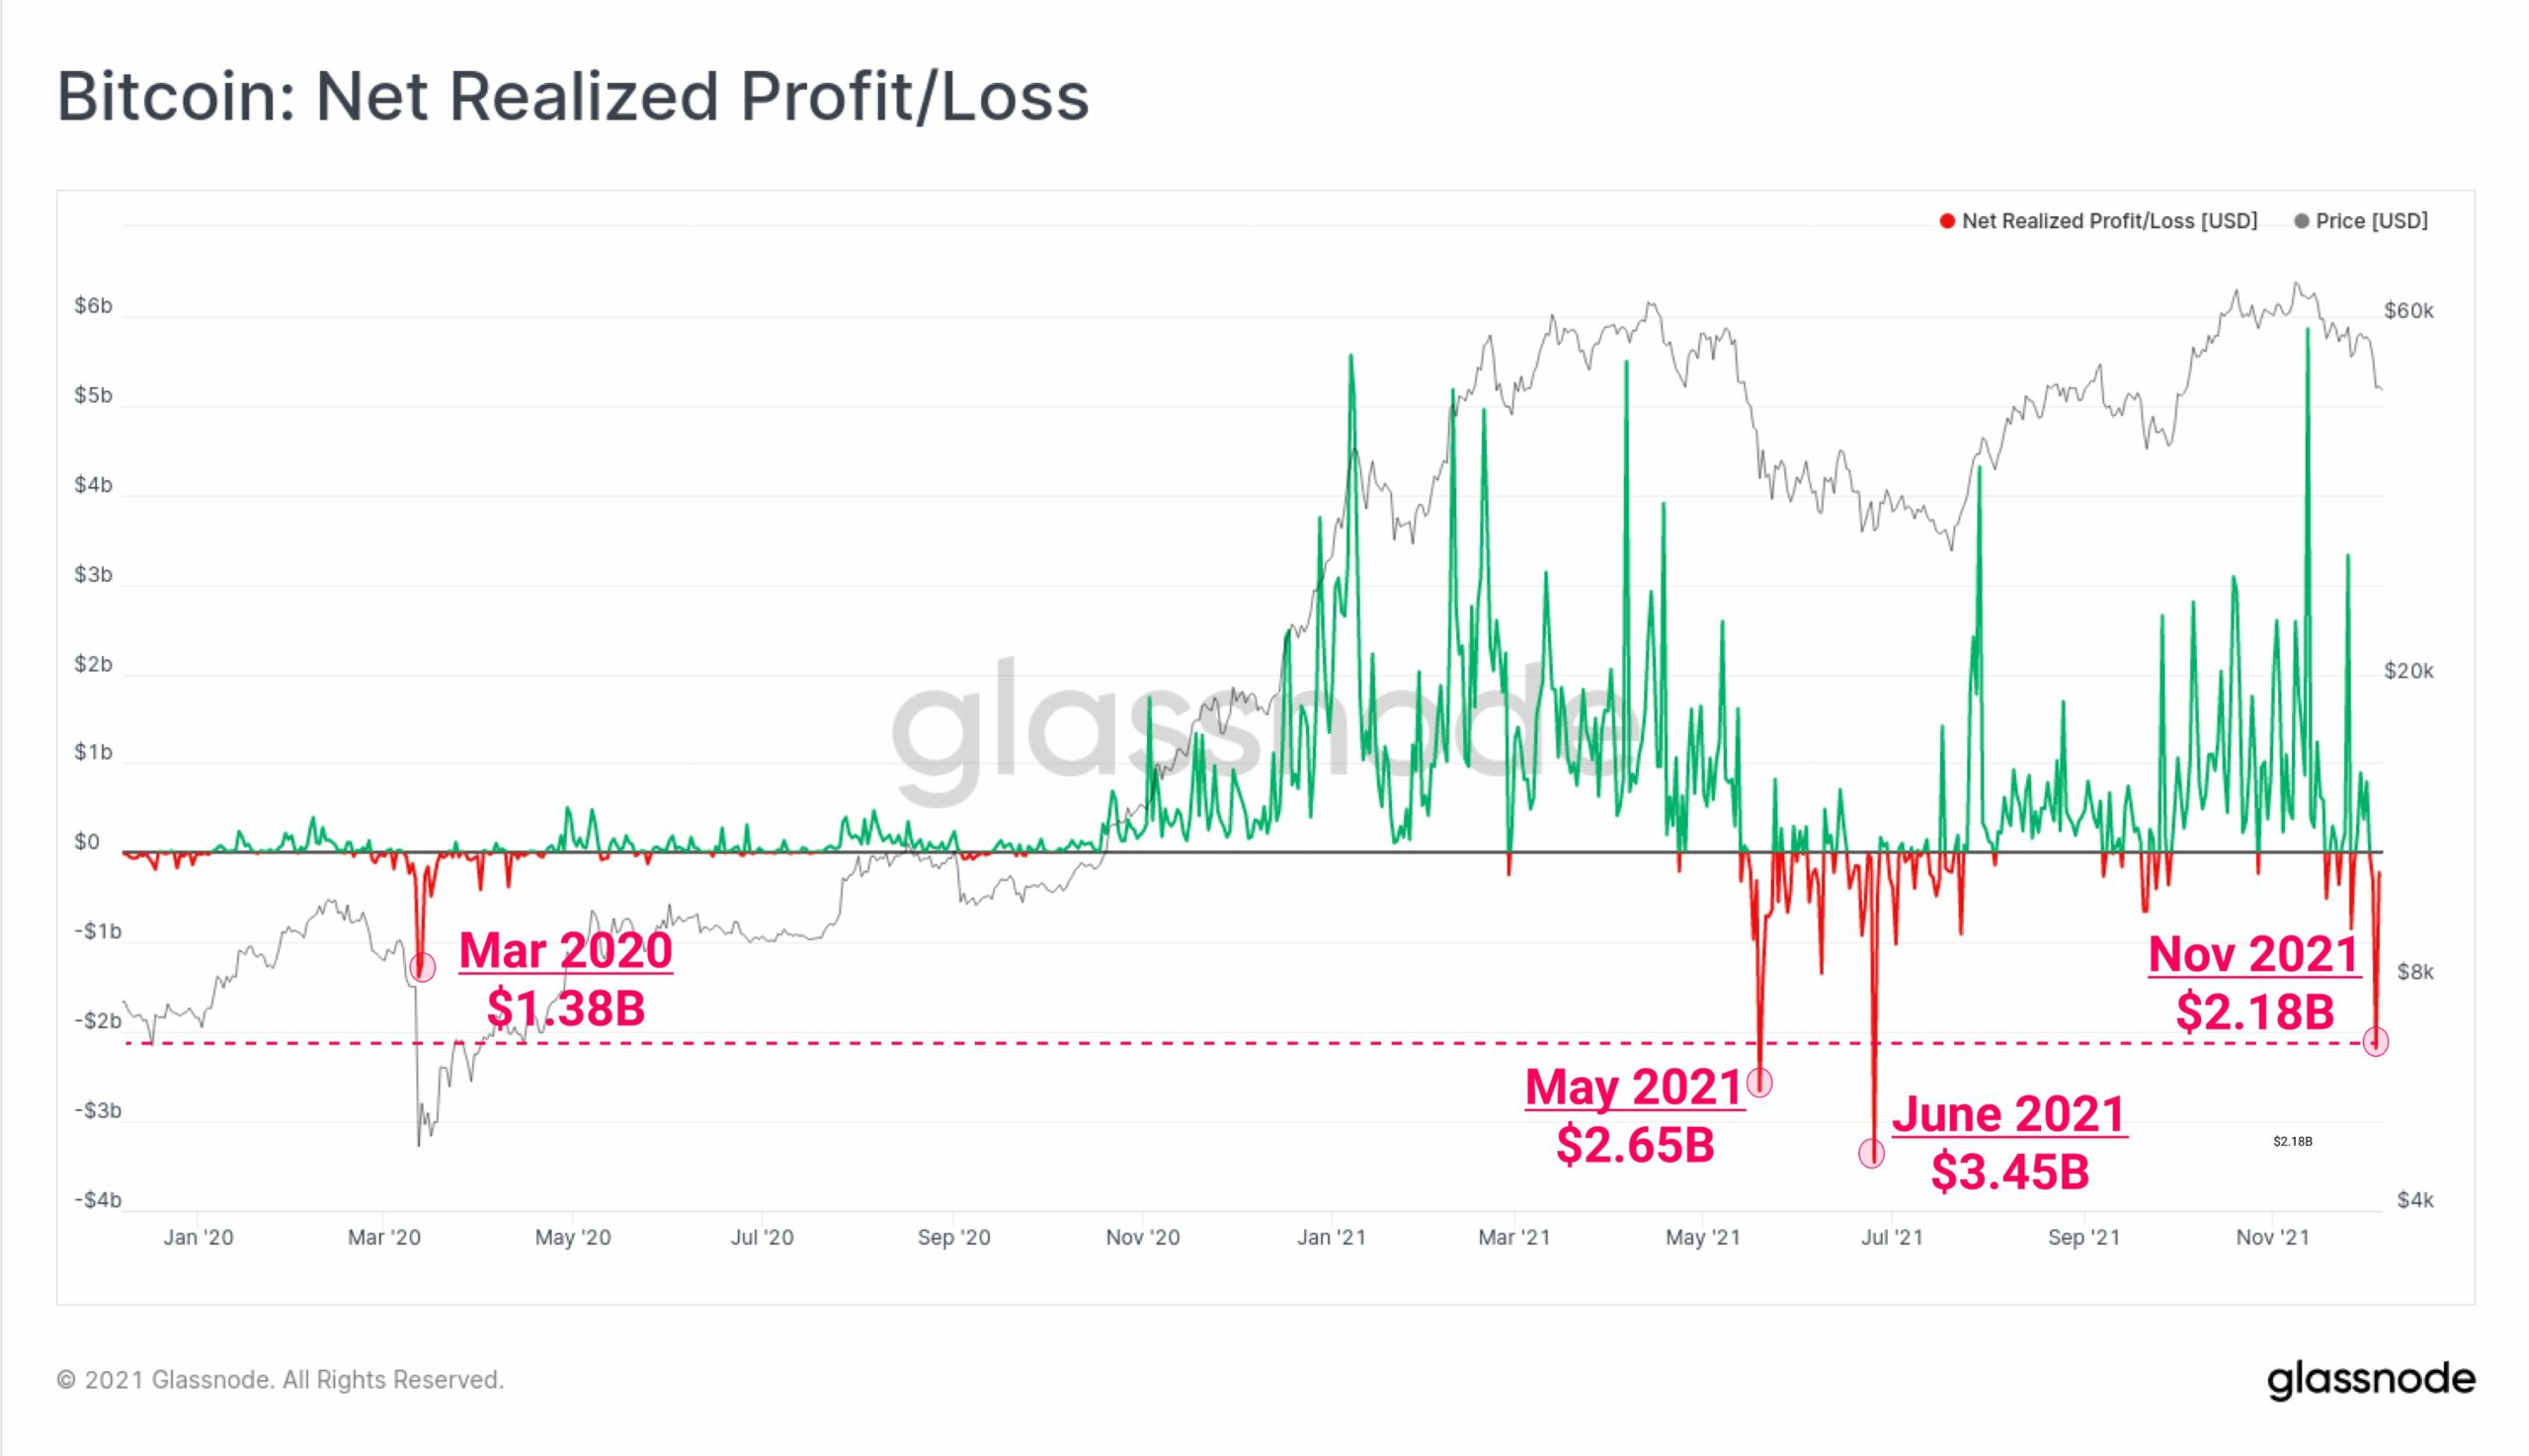
Over the weekend, Bitcoin HODLers realized the third-largest on-chain capitulation in history, with over $2.18 billion in realized losses. The last time this was seen was back in March 2020, then in May this year, and finally in June when there were $3.45 billion realized losses.
Notably, short-term HODLers were increasingly selling or moving their Bitcoin at a loss, as suggested by the short-term holder SOPR.
Post the price crash, the short-term holder SOPR has been dropping further into negative territory to levels last seen in July.

This means that coins by short-term holders have been increasingly sold at a loss. While this could be a capitulation before another leg up, there can be two possibilities going forward.
One scenario could be sideways price movement similar to the short-term SOPR drop in May or it could be capitulation before another leg up for Bitcoin’s price as seen in July.
When to make the next move?
The taker buy/sell ratio 30 HMA by day and price pairs show that selling pressure is overwhelmingly higher than buying pressure.
In the past, when the taker buy/sell ratio has entered the positive territory of the 1.0-threshold, the price has risen significantly.
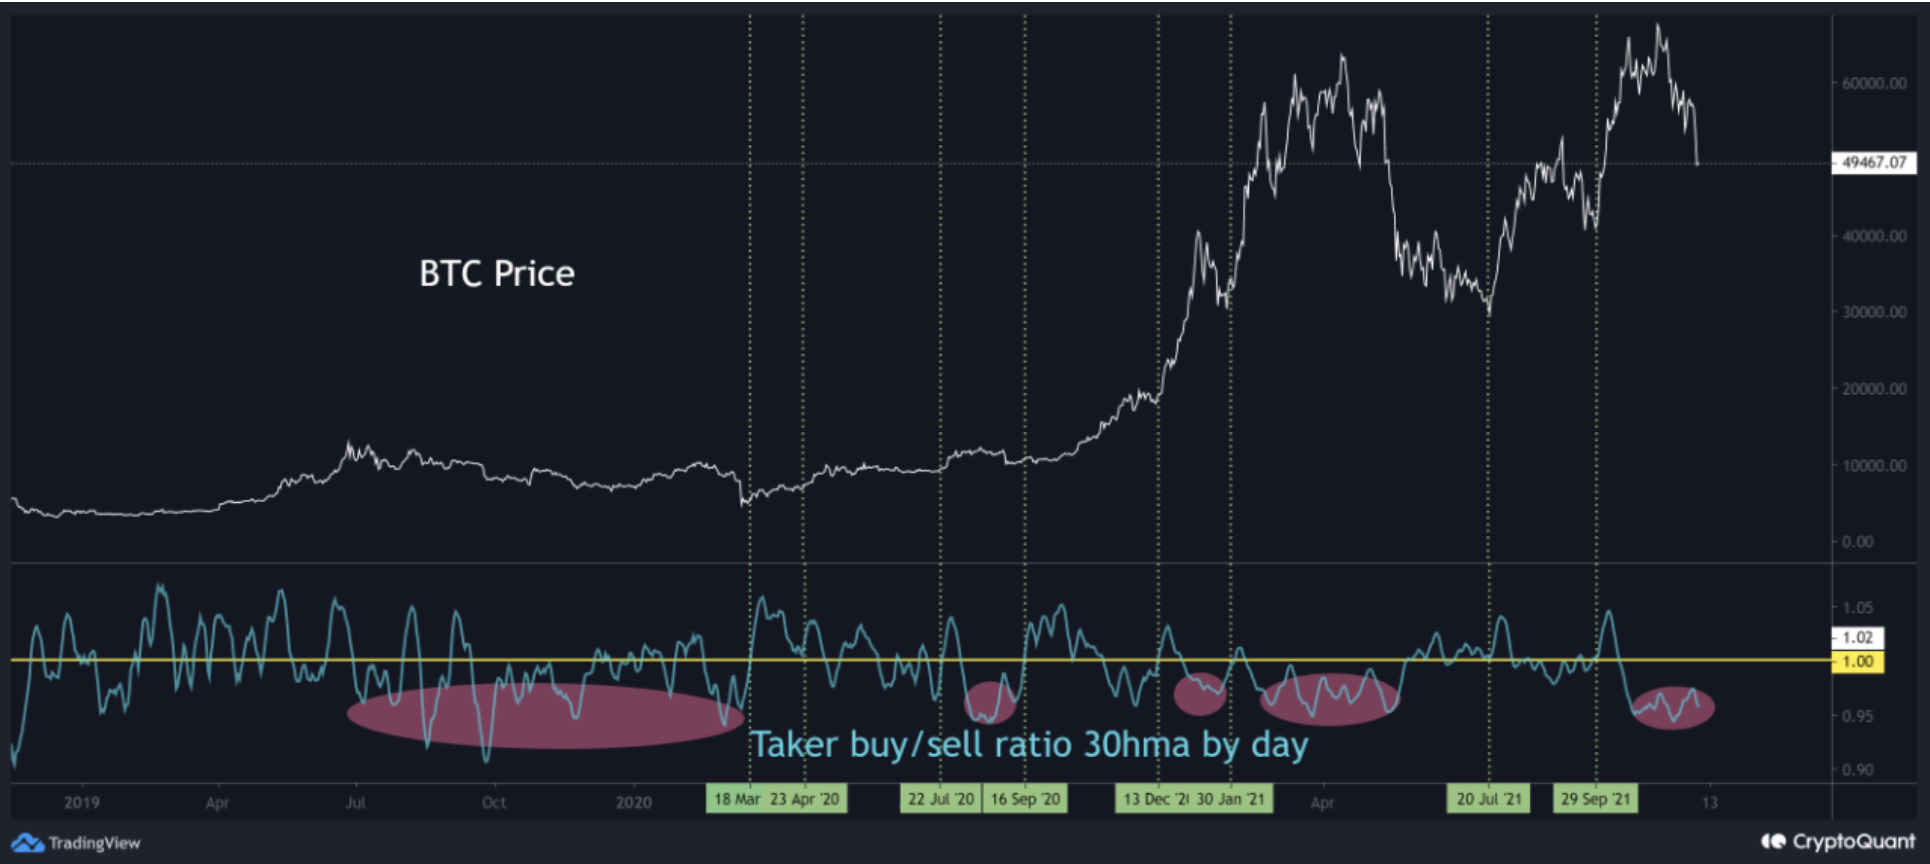
Now, while some short-term on-chain indicators are suggesting a bounce, until this metric returns to positive territory, even if there is a temporary rebound, there is a possibility of further decline.
For now, with the price around the 50W MA – A trendline support of the 2021 bull run – If price is able to hold the support and reclaim the $53k-level, the same could be a good entry point.
However, with BTC’s price still under $50k, it’ll be best to be cautious as higher volatility could plague the crypto.