IOTA: Assessing if higher timeframe bears could be defeated in June

Disclaimer: The findings of the following analysis are the sole opinions of the writer and should not be considered investment advice.
IOTA has been in a steady downtrend on the price charts since September 2021. The time period from October to December saw the price form a range, but the range lows were tested multiple times in December, and broken in January.
In the past few days, IOTA has seen a move upward, but it was beneath the $0.37 resistance which it was rebuffed from in May. Now, the most pertinent question is- Can the bulls force their way through in June?
IOTA- 1 Day Chart
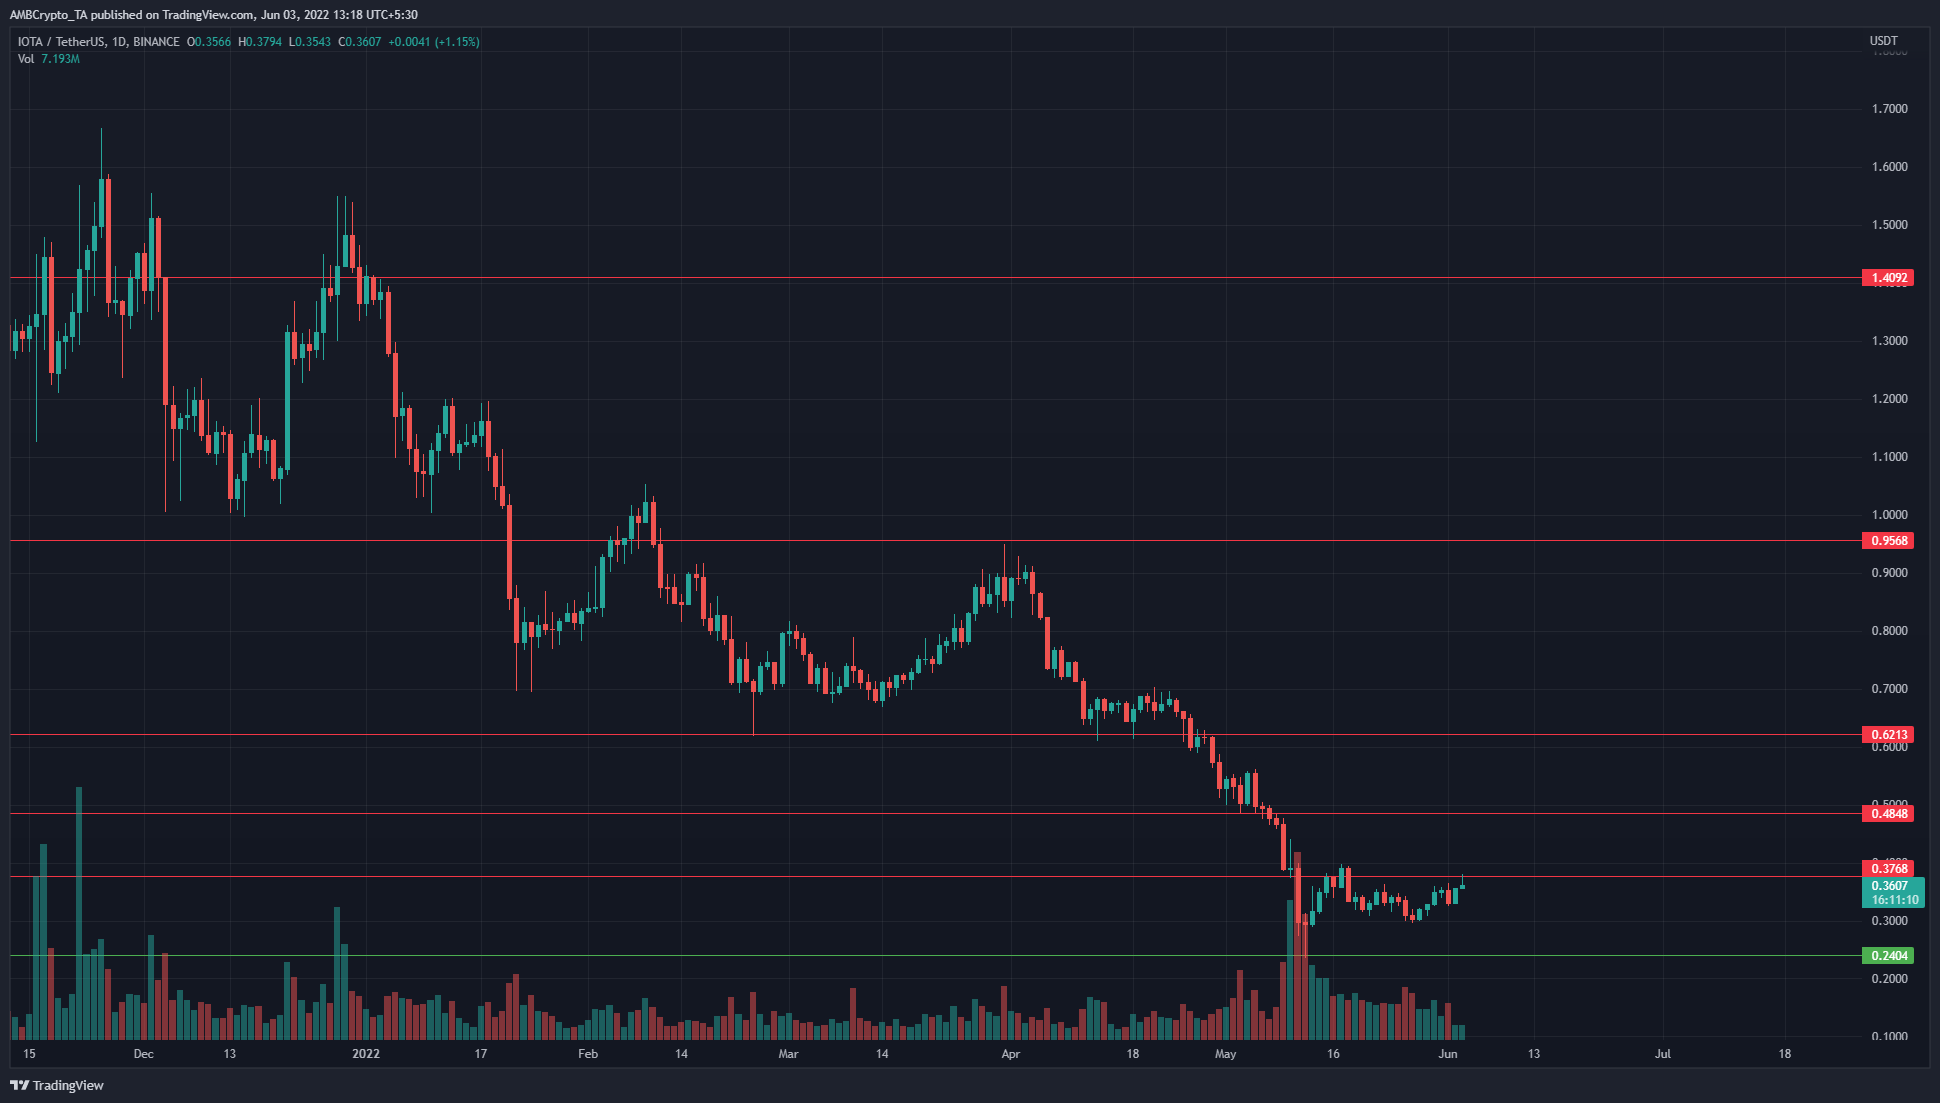
The $0.95-$1 resistance zone was retested as resistance in the late March rally. Bitcoin had a good rally from late January to early April, when BTC rose from the $34k area to the $47.2k mark. However, IOTA formed lower highs on the daily chart in the same time period. This showed that the IOTA had strong bears.
At the time of writing, the price approached the $0.37 resistance again, an area where it had formed a bearish engulfing candle in mid-May. It appeared likely that another test of the $0.37-$0.4 area would meet with rejection, and could set IOTA on a move southward to the $0.24 support.
Rationale
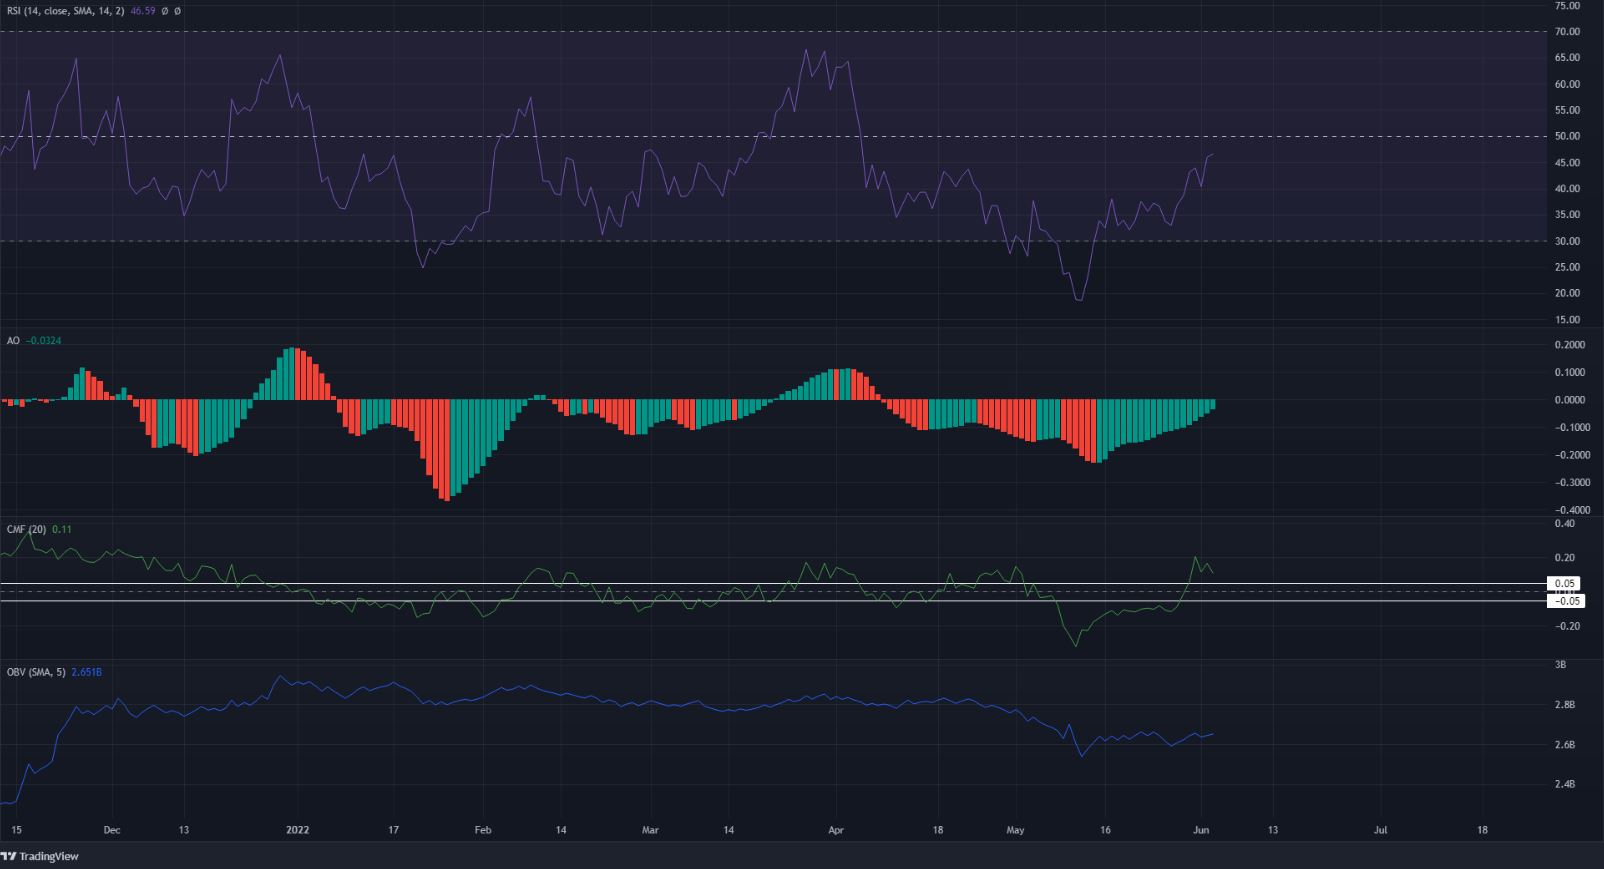
The RSI on the daily chart was beneath neutral 50, and has been since April. This highlighted the strong bearish trend behind IOTA over the past two months. However, the RSI has been forming higher lows and climbing toward the neutral 50 line.
The Awesome Oscillator was also beneath the zero line, but has formed green bars on its histogram over the past three weeks to denote weakening bearish momentum. As things stand, this move toward $0.37 appears to be a pullback in a downtrend, than a shift in momentum toward the bulls.
The CMF rose above +0.05, which meant significant buying pressure was seen. However, the OBV has been unable to climb past the May highs, which meant the buying volume was not particularly strong.
Conclusion
The market structure remained bearish, and the $0.37-$0.4 was a strong resistance zone. The indicators showed only a pullback in motion and not a trend reversal. Hence, the $0.37 area can be a selling opportunity.
Buyers would want to wait for the $0.4 level to be retested as support before punting a buy targeting the $0.48 resistance as take profit.