IOTA climbing higher on the charts but $1 could pose some difficulties

Disclaimer: The findings of the following analysis are the sole opinions of the writer and should not be considered investment advice
In mid-January, IOTA plummeted from $1.18 to $0.68 in a matter of days. Since those lows, it has been quick to climb back above the $0.78 support level. Bitcoin has been surging in recent hours and the coin rode that momentum to climb above the $0.94 resistance level. The round-number resistance at $1 was in close proximity. But it appeared likely that the price would climb past this level as well in the days to come.
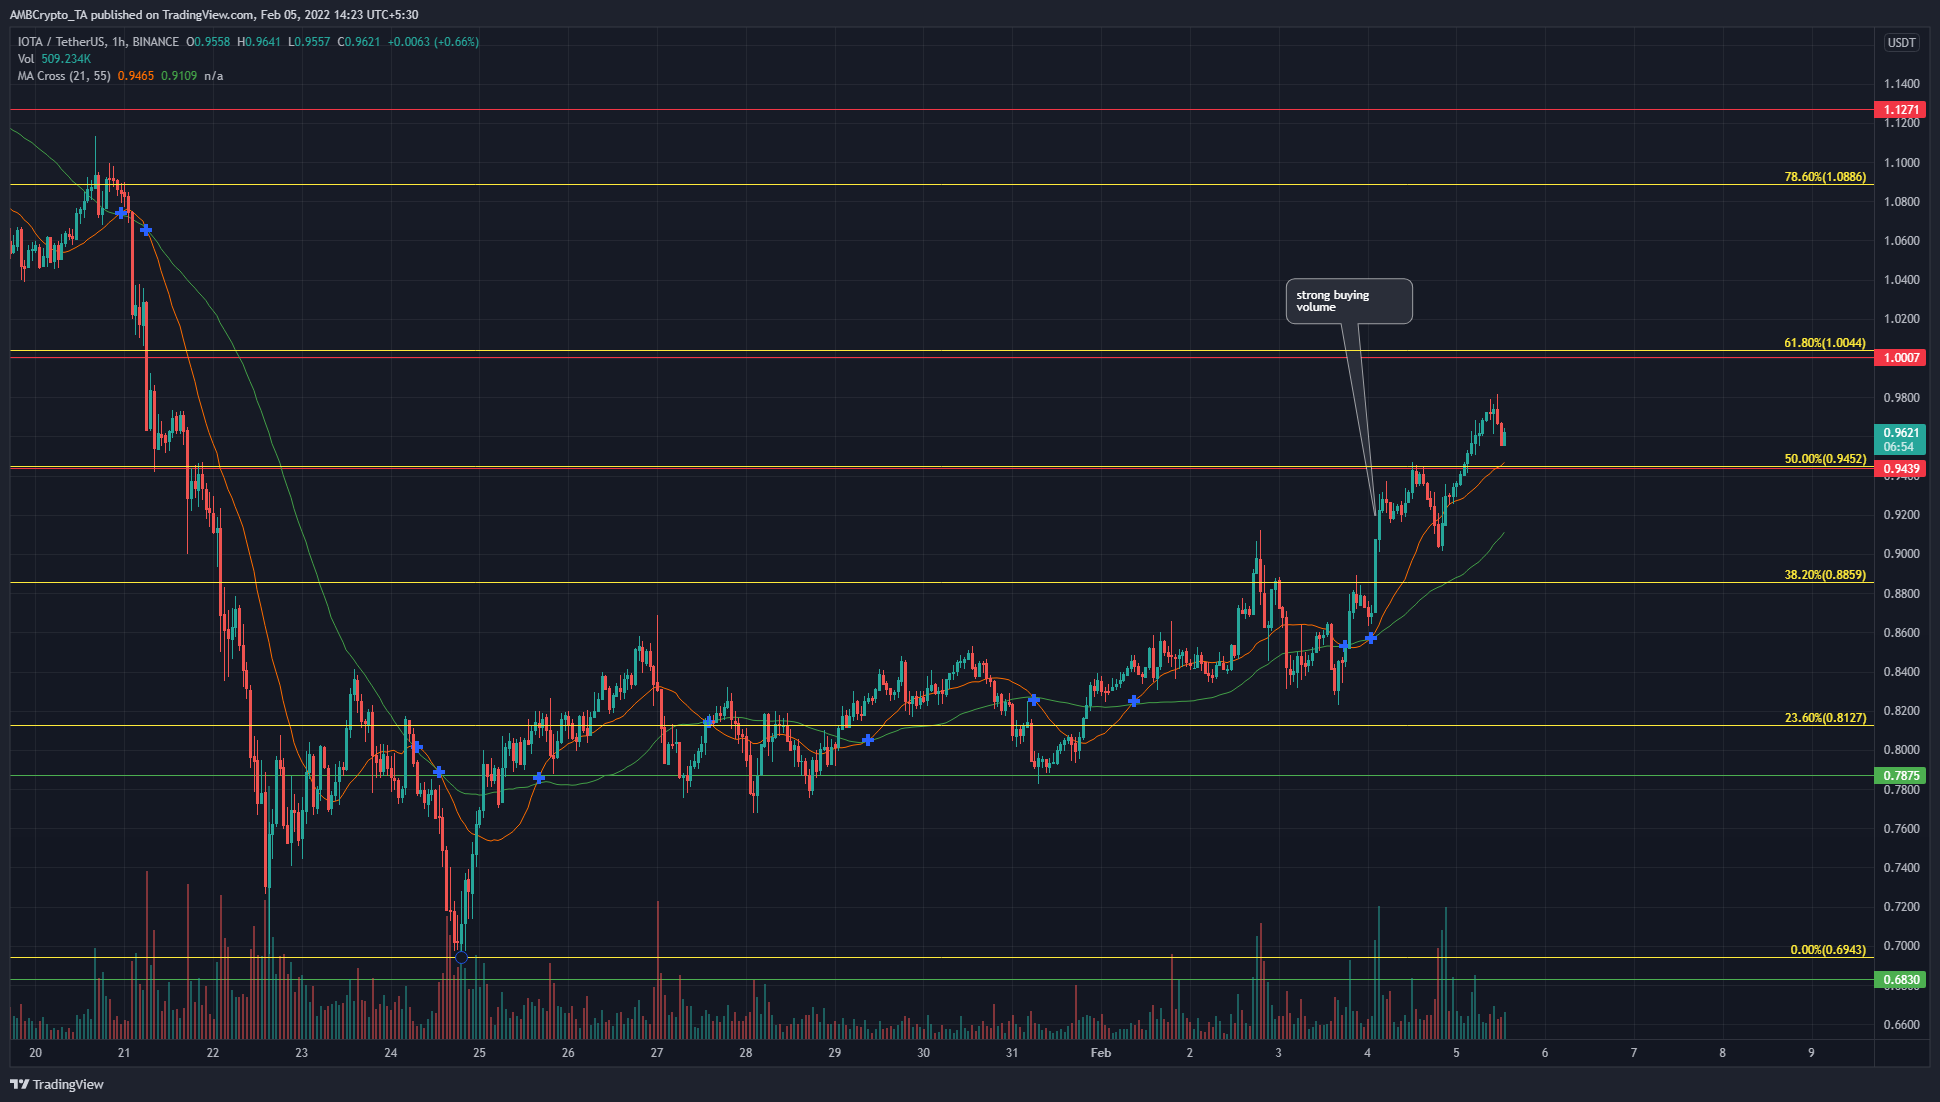
After the move down to $0.69, the local lows were established when IOTA moved swiftly back above the $0.78 support level. The near-term market structure had flipped as IOTA broke the previous lower high at $0.84 and had set higher lows just below $0.78.
Even though the long-term trend was leaning bearish, the past two weeks have seen IOTA slowly but steadily grind its way higher up the charts. The Fibonacci retracement levels were plotted based on IOTA’s drop from $1.19 to $0.69. They showed that IOTA had retraced a sizable chunk of this drop.
On the move upward, the coin has seen a rise in buying volume as well in recent days. This showed that buyers had more and more confidence in IOTA’s bullish performance which was a sign of strength.
Rationale
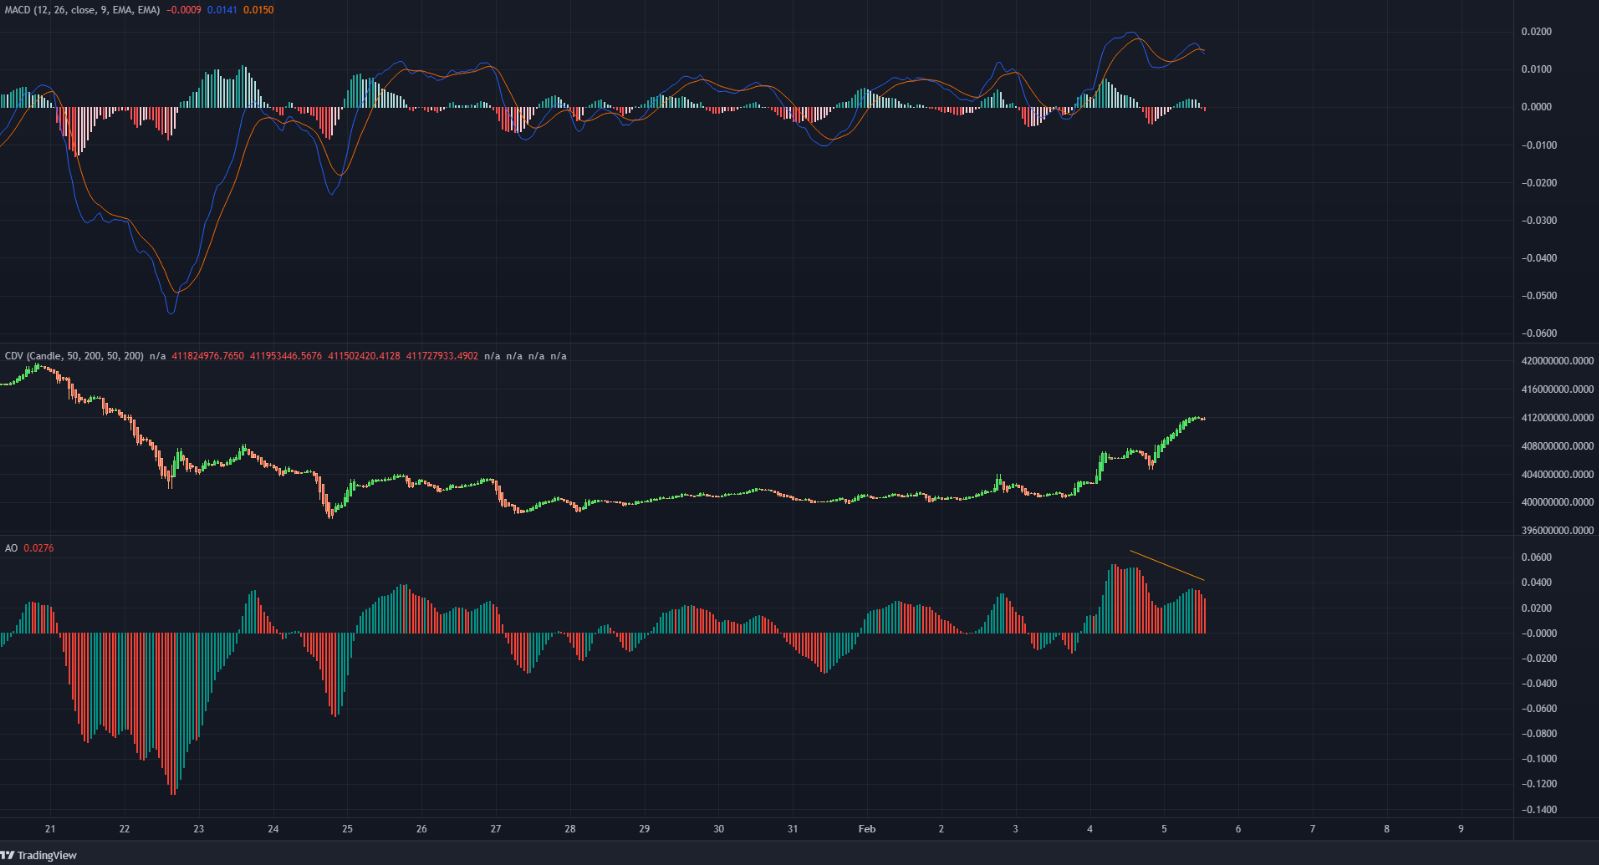
The MACD remained firmly above the zero line to show strong bullish momentum, although it appeared on the verge of forming a bearish crossover. The strong demand behind the recent rally is reflected in the CDV. This indicator has seen a strong uptick in the past few days.
The Awesome Oscillator made a lower high even as the price made a higher high. This bearish divergence could see a pullback for the price in the next couple of days.
Conclusion
Bitcoin’s move above $40.6k was a bullish development for the crypto markets in the short term. The asset was likely to face some selling pressure in the $0.94-$1 area. These are two long-term resistance levels that sellers could look to step in at. The area from $1-$1.05 has been one of strong demand in recent months. However, the price was on the verge of retesting this from below. It could be a good idea to wait for this conflict from buyers and sellers to resolve, before riding the winner’s coattails.


