
Disclaimer: The information presented does not constitute financial, investment, trading, or other types of advice.
- Asset showed some weakness on the price charts after falling below $0.24 in March
- Momentum was neutral with capital inflows, but it was likely that IOTA prices could go lower
IOTA (IOTA/USD) has recorded a rollercoaster ride in terms of price fluctuations over the past year. The token was trading at $0.79 on 1 March 2022, $0.169 on 1 January 2023, and $0.242 on 1 March 2023.
Realistic or not, here’s IOTA’s market cap in BTC’s terms
At press time, IOTA/USD was valued at $0.211 after posting 6% gains in the last 24 hours, retracing from $0.217 to $0.211. This analysis will examine key technical indicators on the 1-day timeframe, including the Relative Strength Index (RSI), Bollinger Bands, On-Balance Volume (OBV), Chaikin Money Flow (CMF), Moving Averages, MACD, Money Flow Index (MFI), and Parabolic SAR.
Analysis showed a downtrend could begin for IOTA under this support level
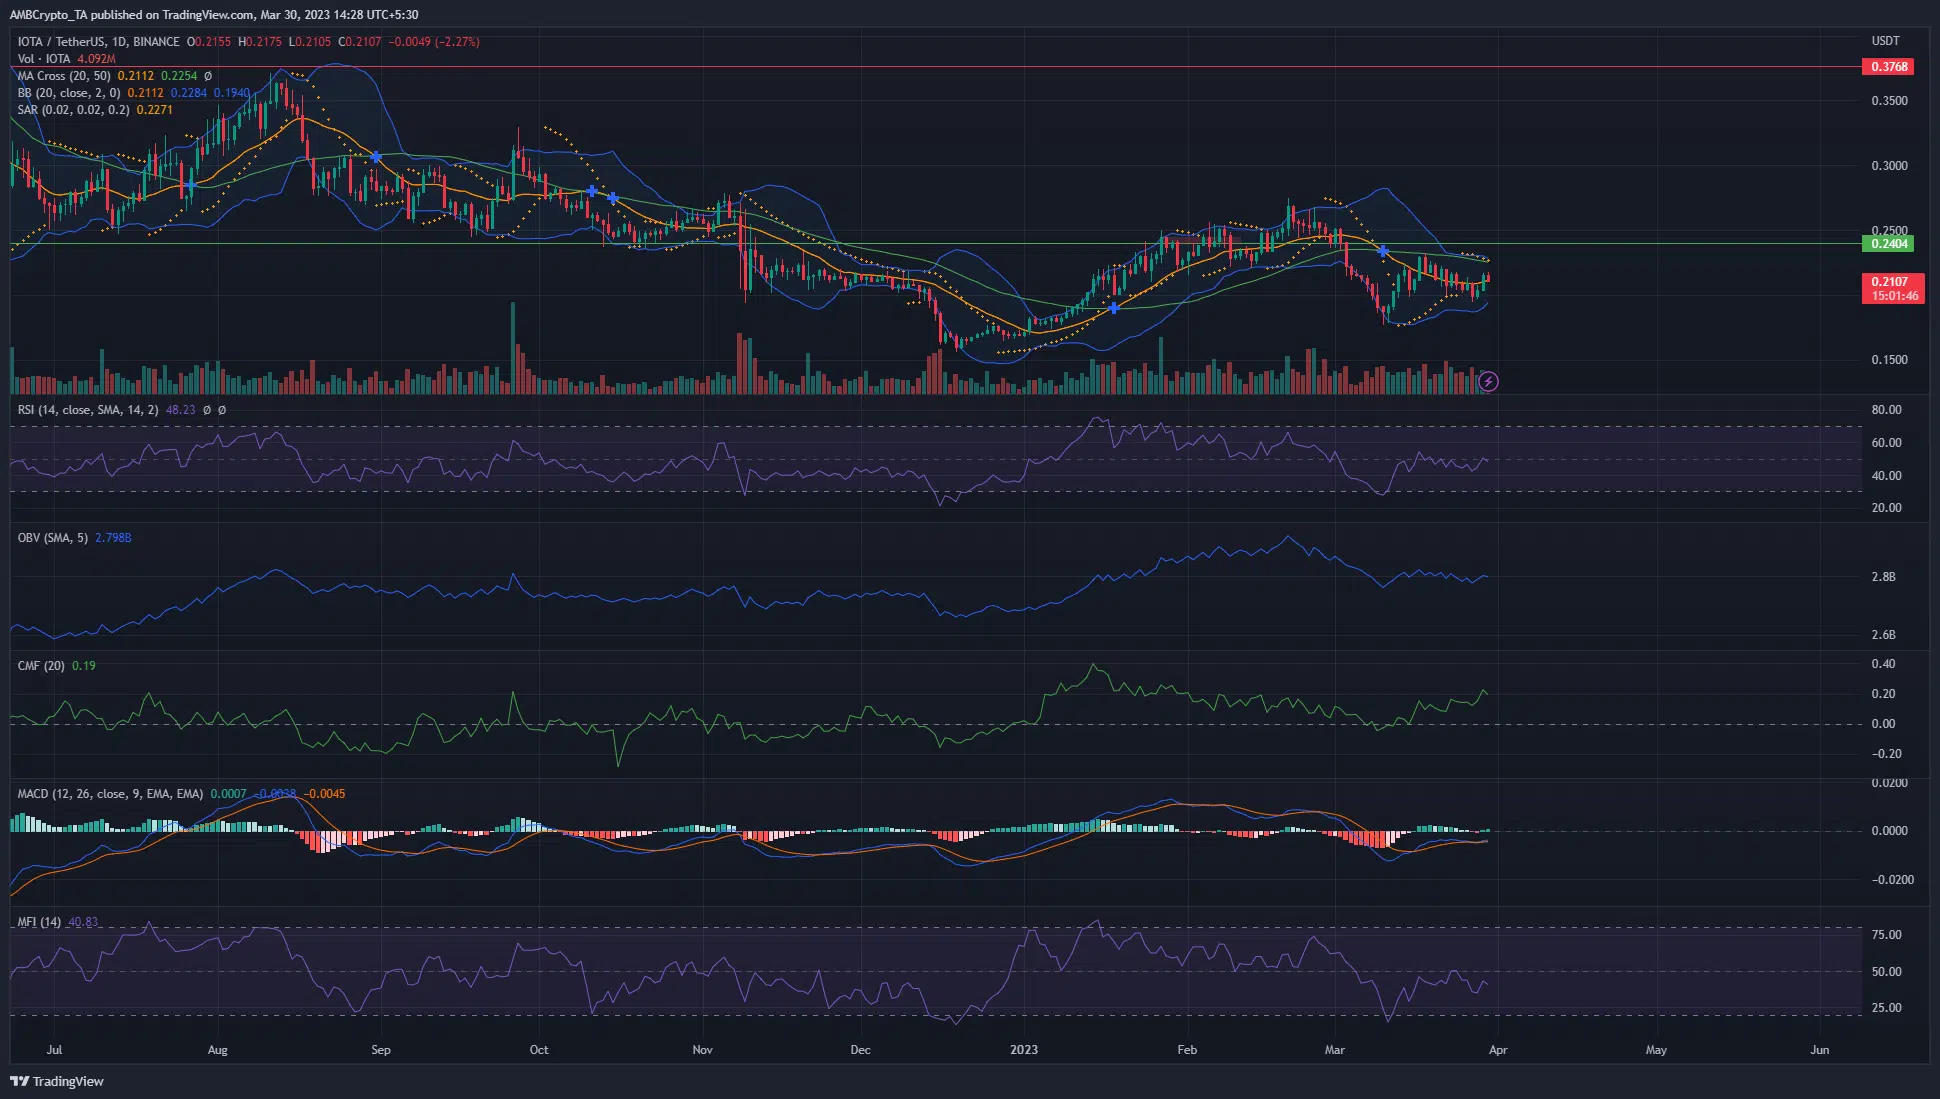
Source: IOTA/USDT on TradingView
IOTA is a crypto token that has a positive correlation with Bitcoin (BTC) on the price charts. With Bitcoin facing strong resistance at $28.7K, IOTA could record a pullback. The market sentiment has been bullish in March, but there’s a possibility of a correction south for both BTC and IOTA.
Key Highlights –
- RSI at 48.3, reflecting neutral market sentiment
- Bollinger Bands converging, indicating a potential price breakout
- OBV at 2.8 billion, flat for the past two weeks
- CMF at +0.19, suggesting strong buying pressure
- Moving Averages: 20 SMA at 0.211, 50 SMA at 0.225
- MACD below zero line and formed a bearish crossover
- MFI at 40.8, indicating bearish momentum
- Parabolic SAR’s dots were above price candles, signalling a short-term bearish trend
- Significant support levels: $0.2035 and $0.178
- Significant resistance levels: $0.24 and $0.277
Considering the technical indicators, IOTA/USD seems to be facing potential challenges at significant resistance levels of $0.24 and $0.277. The 20 and 50 SMA levels are close to the press time price, indicating mixed sentiments in the short term. The bearish MACD crossover was a sign that the bears have taken control of the market.
How much are 1, 10, or 100 IOTA worth today?
The RSI stood at 48.3, indicating a neutral market sentiment for IOTA/USD. The Bollinger Bands were converging, suggesting that a price breakout could be imminent in either direction. The OBV remained flat at 2.8 billion for the past two weeks, highlighting no significant change in buying or selling pressure.
Despite neutral momentum, buying pressure favoured the bulls
The CMF had a reading of +0.19, pointing to strong buying pressure in the market. However, the bearish MACD crossover and MFI at 40.8 indicated growing bearish momentum. The Parabolic SAR’s dots were above the price candles too, signalling a short-term bearish trend.
In conclusion, IOTA/USD presents a neutral trading signal, with mixed signals from the technical indicators and potential market uncertainty. Traders should closely monitor Bitcoin’s performance, as its critical resistance at $28.7k could impact IOTA’s price action. Additionally, traders should keep an eye on key support and resistance levels, as well as the aforementioned indicators, to determine the future price trajectory.
The converging Bollinger Bands and the potential pullback for both Bitcoin and IOTA suggest that caution is warranted in the prevailing market environment.