Bitcoin
Is a Bitcoin bull run on the horizon? Key metrics provide insight
Bitcoin holds above $70,000 as signals point to a potential bull run. We look at key indicators to gauge what’s next for Bitcoin.

- BTC is close to retesting its all-time high as it rises to the $70,000 price level.
- Indicators are showing that a bull run might be on the horizon.
As Bitcoin [BTC] holds strong above the $70,000 level, investors are increasingly optimistic about the potential for a Bitcoin bull run. By analyzing key indicators, such as the NVT (Network Value to Transactions) ratio, active address data, and current price momentum, we can understand whether Bitcoin is setting the stage for a long-term bullish phase or if caution might be needed.
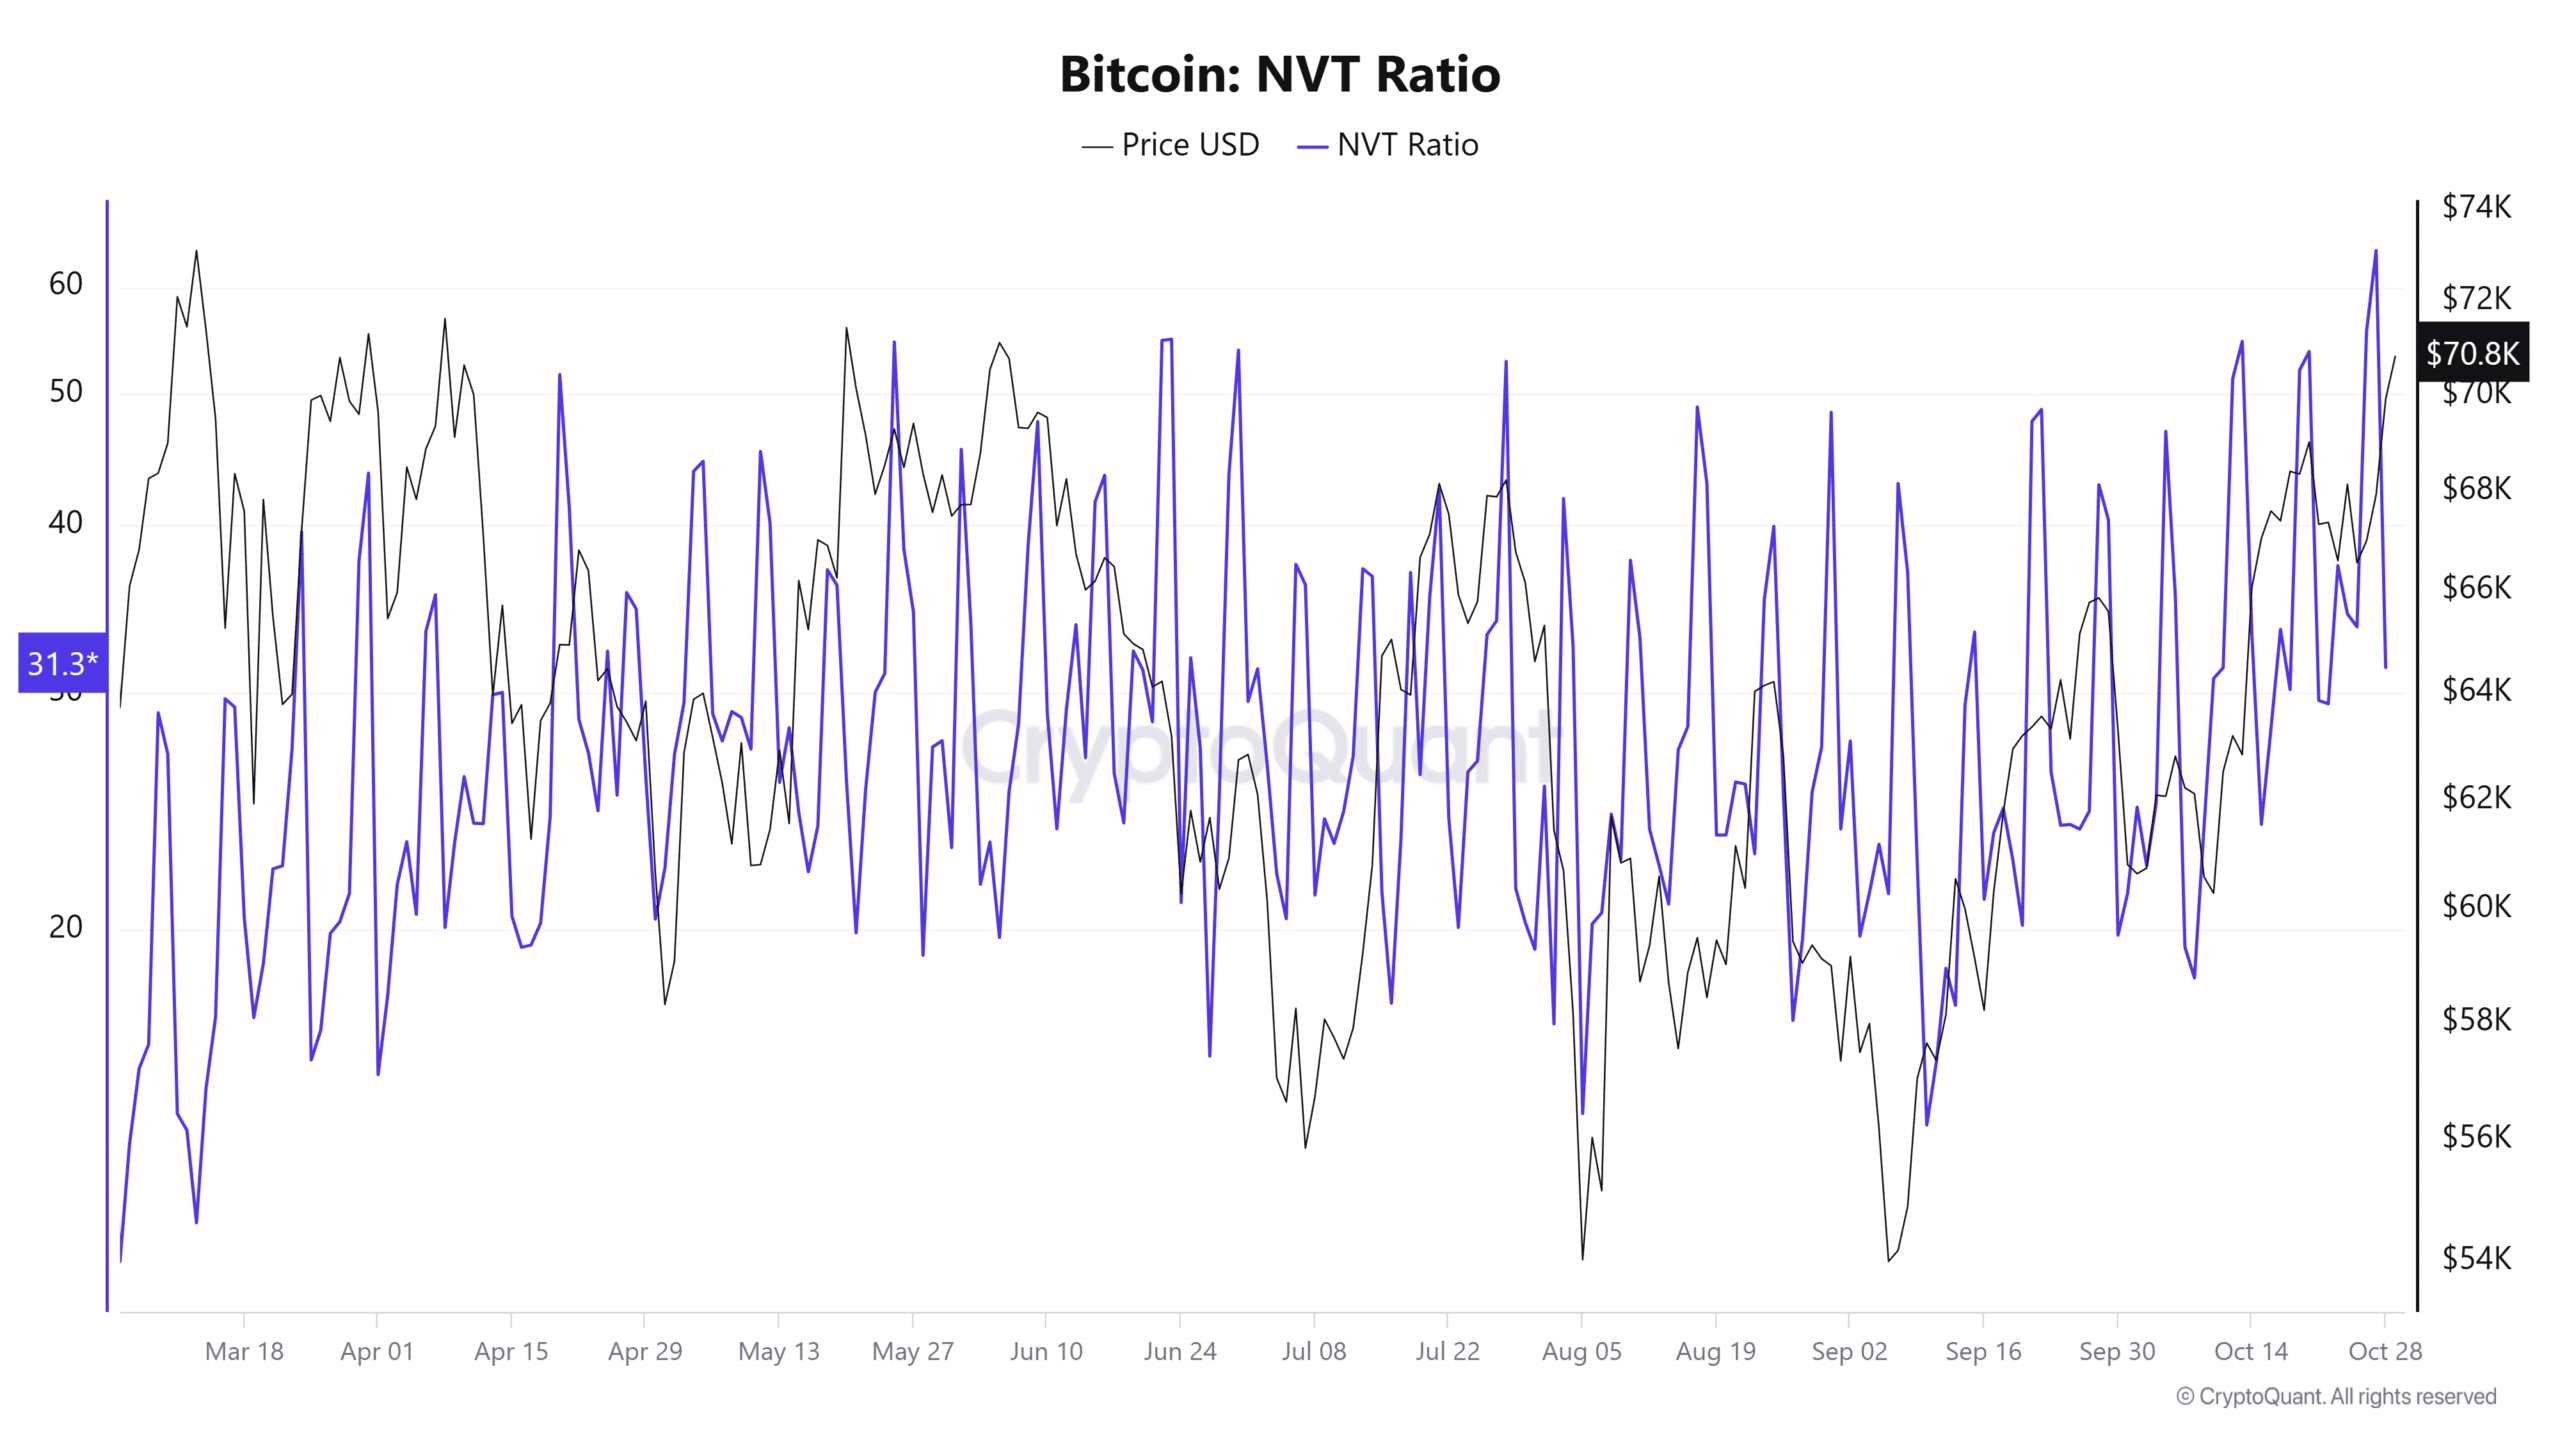
NVT Ratio signals stability for Bitcoin bull run
The NVT ratio, often compared to Bitcoin’s
“price-to-earnings” ratio, provides insight into whether the asset is overvalued or undervalued based on network activity.Currently, the NVT ratio reflects a balanced and healthy market, showing that Bitcoin’s network is handling the heightened demand without signs of overheating.
Historically, a steady or low NVT ratio during price growth has laid the groundwork for a Bitcoin bull run, as it suggests the rally has a strong foundation.
This favorable NVT reading hints that the current price momentum might have the resilience needed to sustain a longer bullish trend.
Rise in active addresses adds fuel to bullish sentiment
A recent uptick in active Bitcoin addresses also supports the case for a Bitcoin bull run. With active addresses now consistently above 935,000, network activity shows healthy growth.
Increased active addresses generally signal greater user engagement, translating to higher demand for Bitcoin. This trend, often associated with price appreciation, could indicate renewed interest in the asset.
Therefore, the sustained rise in active addresses is a key indicator that could bolster the ongoing rally, feeding into the broader narrative of a possible bull market.
Technical indicators support Bitcoin Bull Run potential
Bitcoin’s price chart reveals several bullish signals reinforcing the potential for sustained upward momentum. Bitcoin recently broke through major resistance levels and has shown solid support around the 50-day moving average.
This indicator has often served as a foundation for bullish momentum.
Additionally, the Chaikin Money Flow (CMF) currently reads a positive 0.29, indicating strong buying interest. At the same time, a recent bullish MACD crossover complements this momentum.
Together, these technical indicators align well with Bitcoin’s fundamental strength, building a convincing case for a Bitcoin bull run.
In summary, Bitcoin’s fundamental metrics and technical indicators indicate a favorable environment for a potential bull run.
A balanced NVT ratio, growing active addresses, and supportive technical strength all hint that Bitcoin’s upward momentum could persist.
Read Bitcoin (BTC) Price Prediction 2024-25
Investors tracking the market for signs of a Bitcoin bull run may find encouragement in these metrics.
However, close monitoring of key indicators will remain essential to gauge the sustainability of this rally, as Bitcoin could be on the verge of setting new all-time highs in the months to come.


