Is a Bitcoin price correction coming? Assessing key levels

- Selling pressure on Bitcoin was rising.
- A price correction can push BTC down to $95.8k again.
After crossing a historic $100k mark, Bitcoin [BTC] witnessed a pullback and dropped near the $98k range. Slowly, the king coin was again approaching the triple digit mark.
However, BTC has to face a few obstacles going forward, which can trigger a price correction.
Bitcoin inches towards $100k again, but…
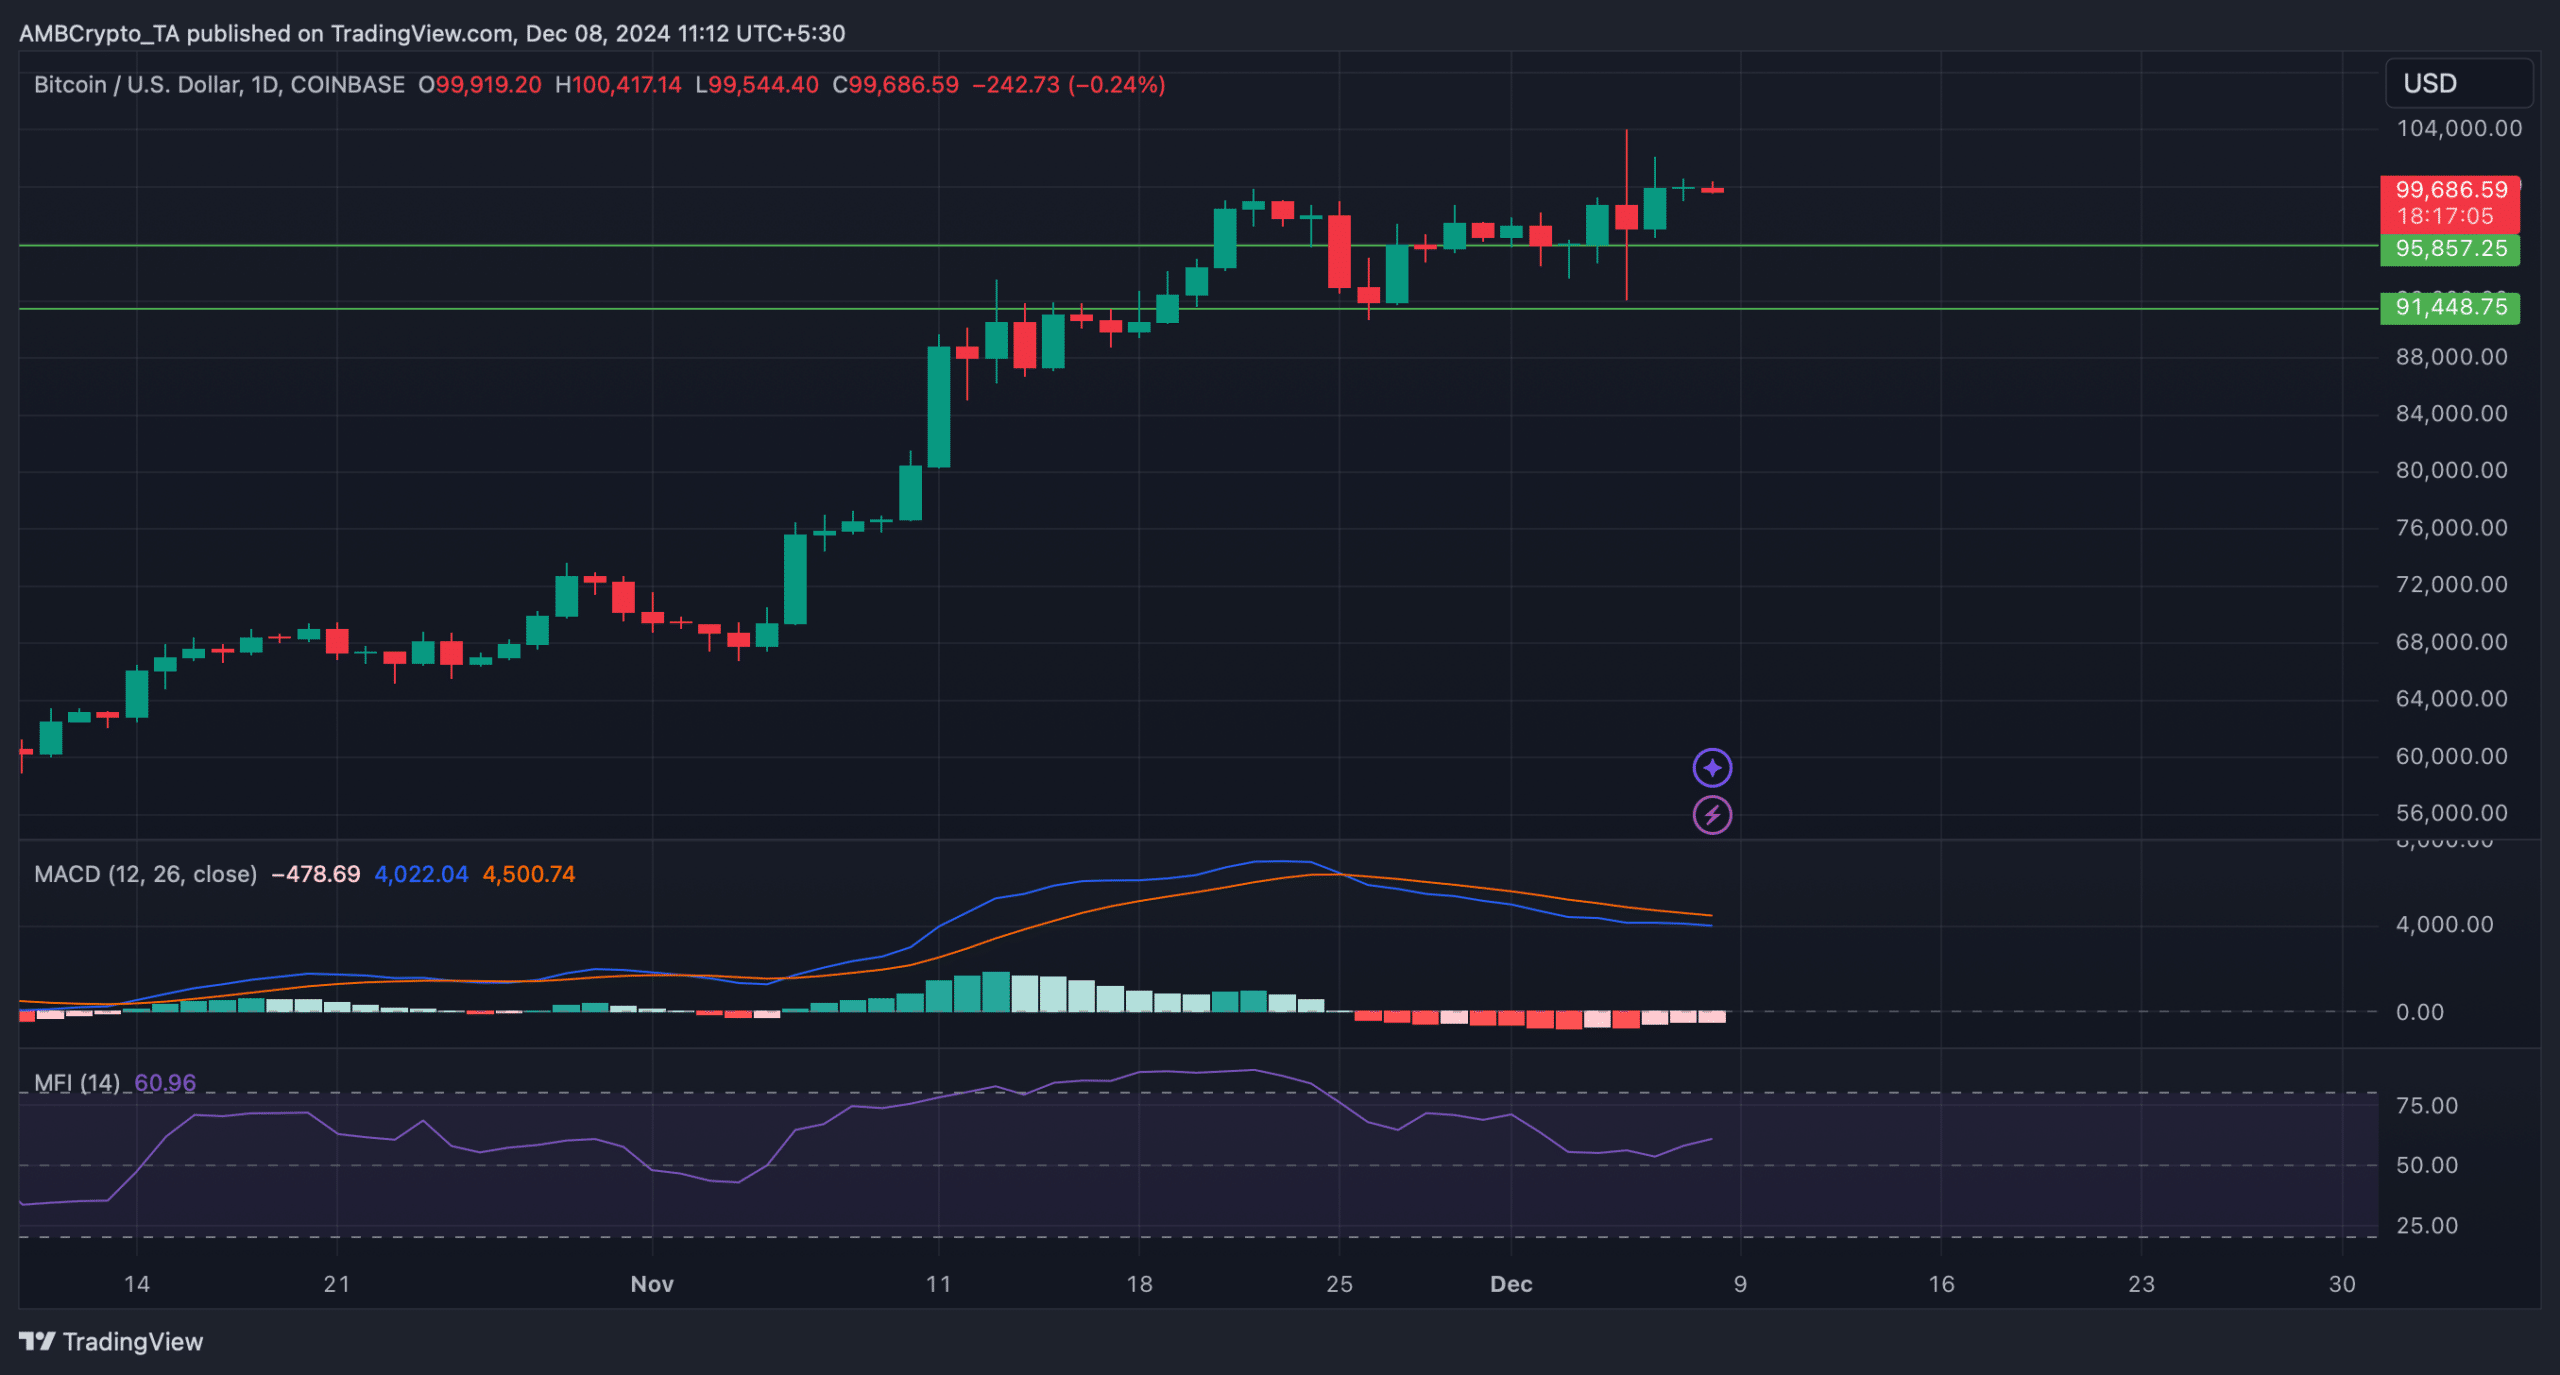
Bitcoin price consolidated in the last 24 hours as its price moved marginally. At the time of writing, the king was trading at $99.6k with a market capitalization of over $1.97 trillion.
However, this slow approach to $100k might not be a successful attempt as a key metric was rising.
IntoTheBlock, a data analytics platform, recently posted a tweet highlight BTC’s MVRV ratio. As per the tweet, Bitcoin’s MVRV was moving closer to historic peak levels.
Generally, when MVRV rises, it is often followed by price corrections.
Historically, BTC witnessed similar pullbacks in 2018, 2021, 2022, and 2024. If history repeats, then BTC investors should prepare themselves to witness a price correction soon.
Is a price correction inevitable?
Not only did the MVRV ratio flag a red signal, a few other on-chain metrics also painted a similar picture. For instance, BTC dominance has been declining of late.
The ratio dropped from 53.7% to 51% last week — a sign of a new altcoin season.
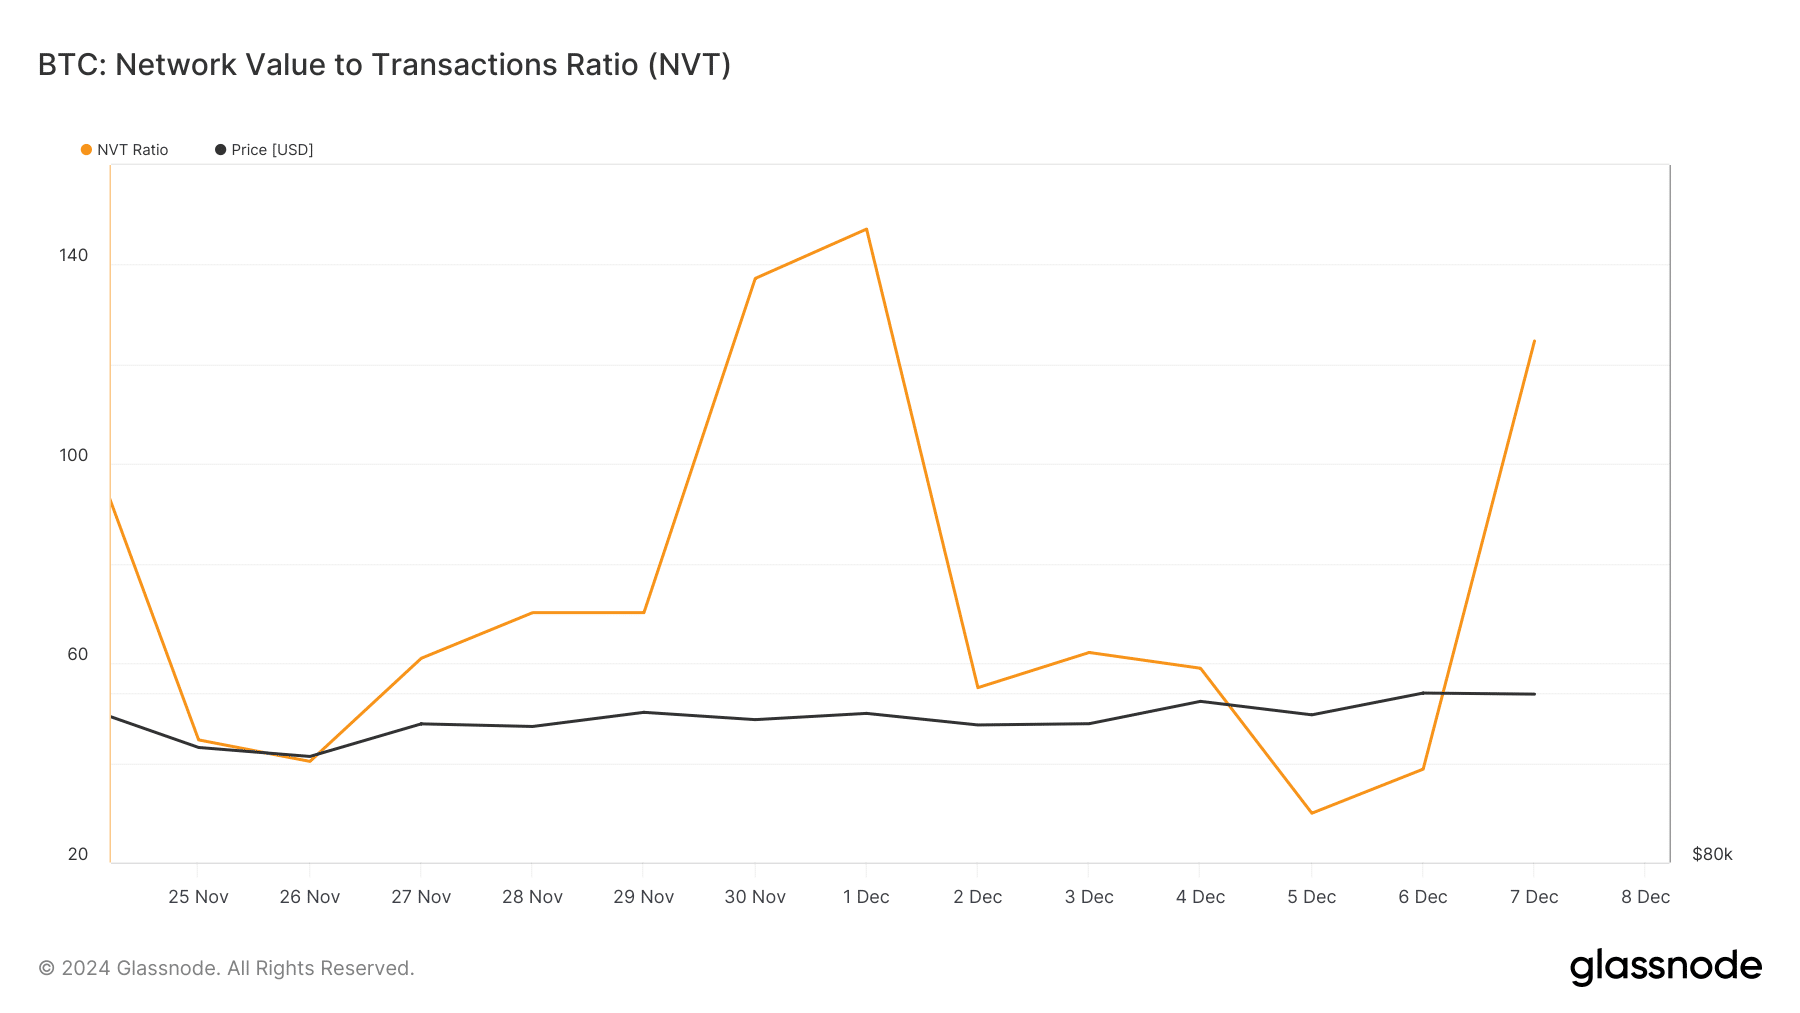
Glassnode’s data revealed that Bitcoin’s NVT ratio registered a sharp uptick. Whenever the metric rises, it indicates that an asset is overvalued, hinting at a price correction going forward.
CryptoQuant’s data also pointed out a few bearish metrics. BTC’s net deposit on exchanges were high compared to the past seven days’ average. This is a clear sign of rising selling pressure on the king coin.
Additionally, the aSORP turned red, meaning that more investors are selling at a profit. In the middle of a bull market, it can indicate a market top.
Apart from that, AMBCrypto reported earlier that miners were showing less confidence in BTC as they were selling their holdings.
To be precise, over the past 48 hours, BTC miners have sold off an incredible 85,503 BTC, bringing miner balances down to about 1.95 million BTC — the lowest level in months.
Read Bitcoin’s [BTC] Price Prediction 2024-25
The technical indicator MACD displayed a bearish advantage in the market. In the event of a price correction, BTC might soon drop to its support near $95.8k. A slip under that could push BTC down to $91k again.
However, the Money Flow Index (MFI) registered an uptick, hinting at a continued price rise. This can push BTC above $100k again in the coming days.


![Bitcoin [BTC]](https://ambcrypto.com/wp-content/uploads/2025/06/Erastus-2025-06-25T110829.705-1-400x240.png)
