
Ethereum: What’s standing between ETH and $3K? – Data suggests…
![Is AI token Render [RNDR] on the road to $8?](https://ambcrypto.com/wp-content/uploads/2024/07/Whales-are-buying-Render-1200x686.webp)
- Render’s weekly and daily charts remained in the red.
- Whales were buying the token, and a few indicators were bullish.
While the global cryptocurrency market capitalization continued to rise, not every crypto managed to paint their charts green. One such example was Render [RNDR].
Though at first glance this looked troublesome, something interesting is going on backstage, which might soon show its effect on the token’s price action soon.
RNDR is falling behind
Bears dominated the market at press time, as RNDR’s weekly and daily charts were in the red.
Per CoinMarketCap, RNDR’s price dropped by more than 3% and 2% over the last seven days and 24 hours, respectively. At the time of writing, RNDR was trading at $6.55 with a market capitalization of over $2.5 billion.
Our look at IntoTheBlock’s data revealed that just 50% of RNDR investors were in profit.

Source: IntoTheBlock
However, the numbers might change soon as something bullish was cooking. Santiment recently posted a tweet revealing an intriguing development.
Notably, RNDR’s address activity rose in the past couple of days. Historically, rising levels of wallets interacting on networks have been a sign of future bullish behavior.
Will RNDR turn bullish?
Since the token’s address activity was rising, AMBCrypto planned to take a closer look at investors’ behavior.
Our analysis of Santiment’s data revealed that whales were scooping up RNDR, as the supply held by top addresses increased sharply.
However, selling pressure overall was dominant in the market. This was evident from the massive rise in its Supply on Exchanges and a decline in the supply outside of exchanges.
Additionally, its exchange inflow shot up, further establishing the fact that investors at large were selling the token.
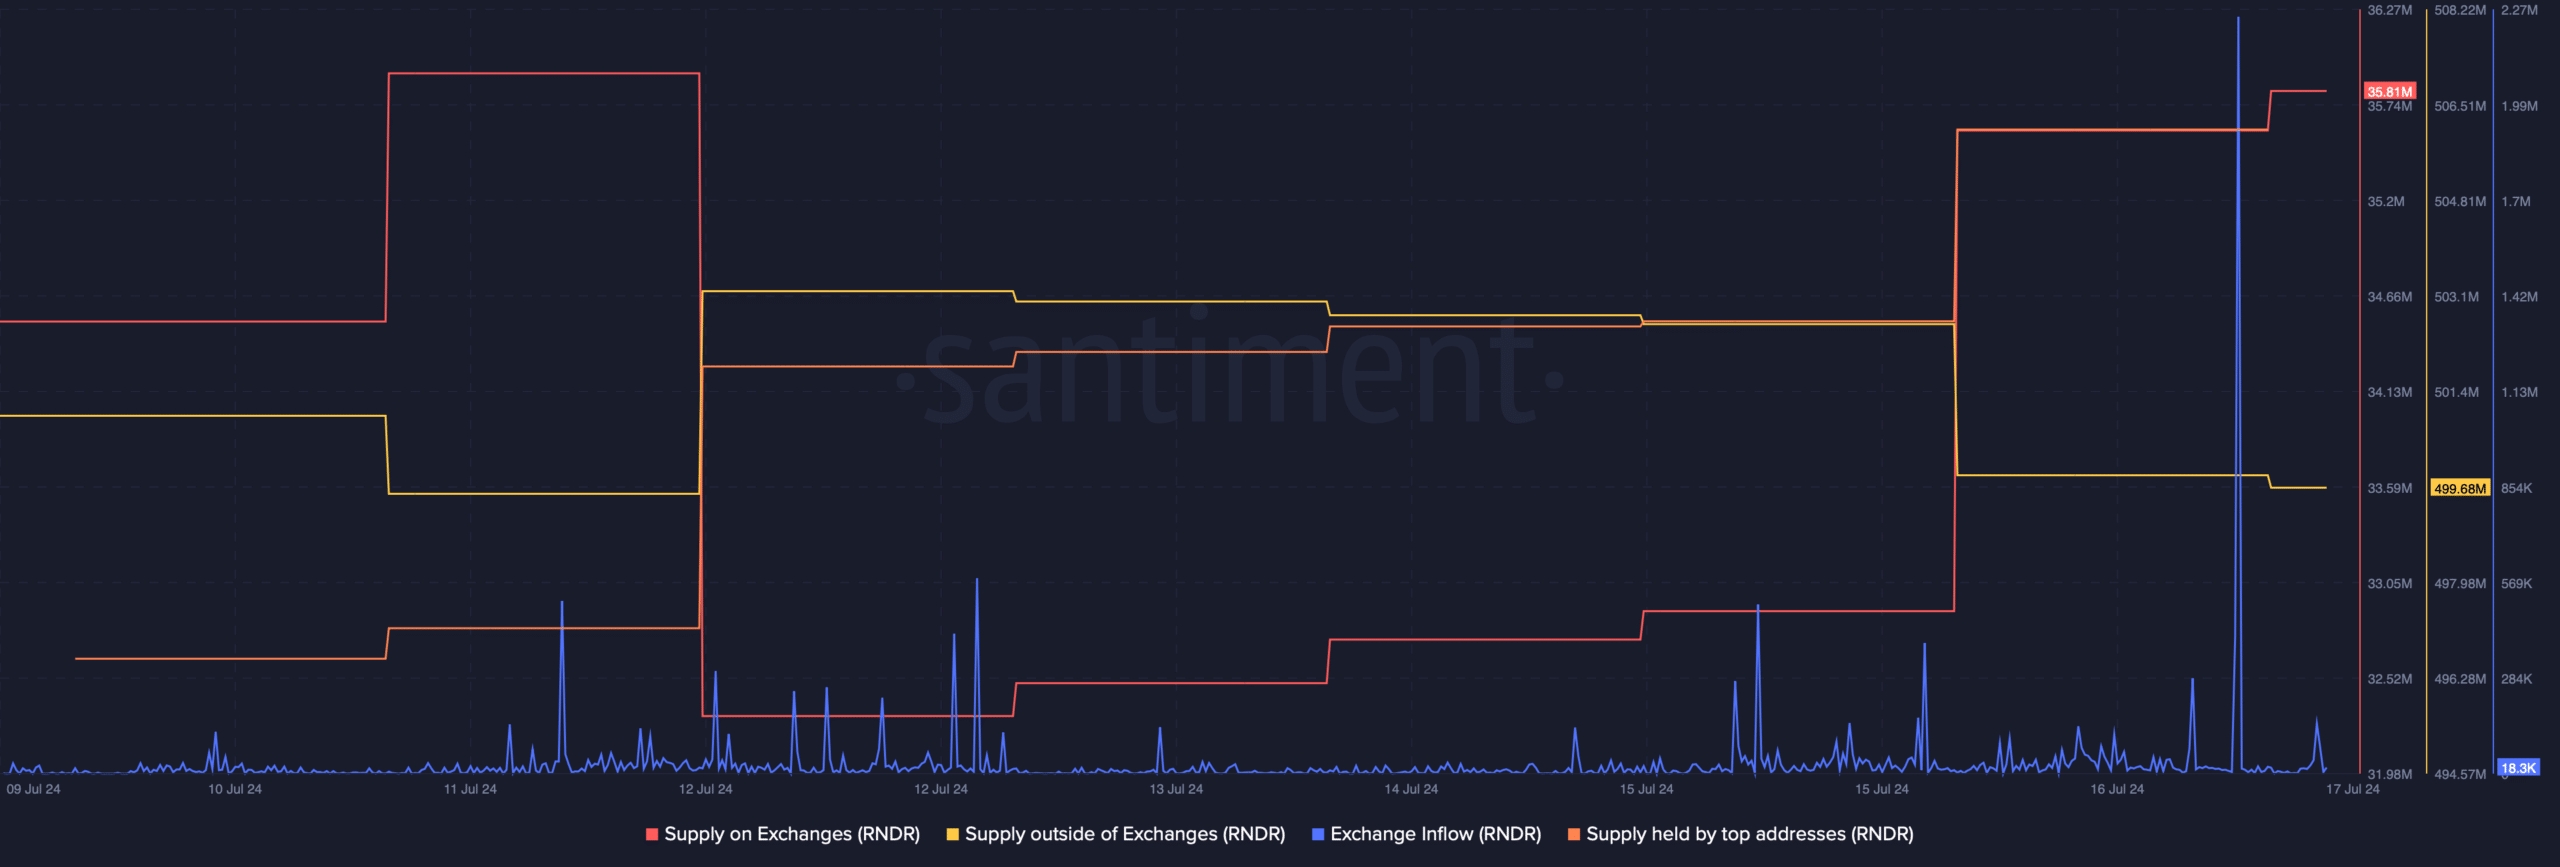
Source: Santiment
The token’s MVRV ratio registered a decline on the 16th of July, which can be inferred as a bearish signal.
Nonetheless, its Weighted Sentiment went into the positive zone, meaning that bullish sentiment around the token was rising.
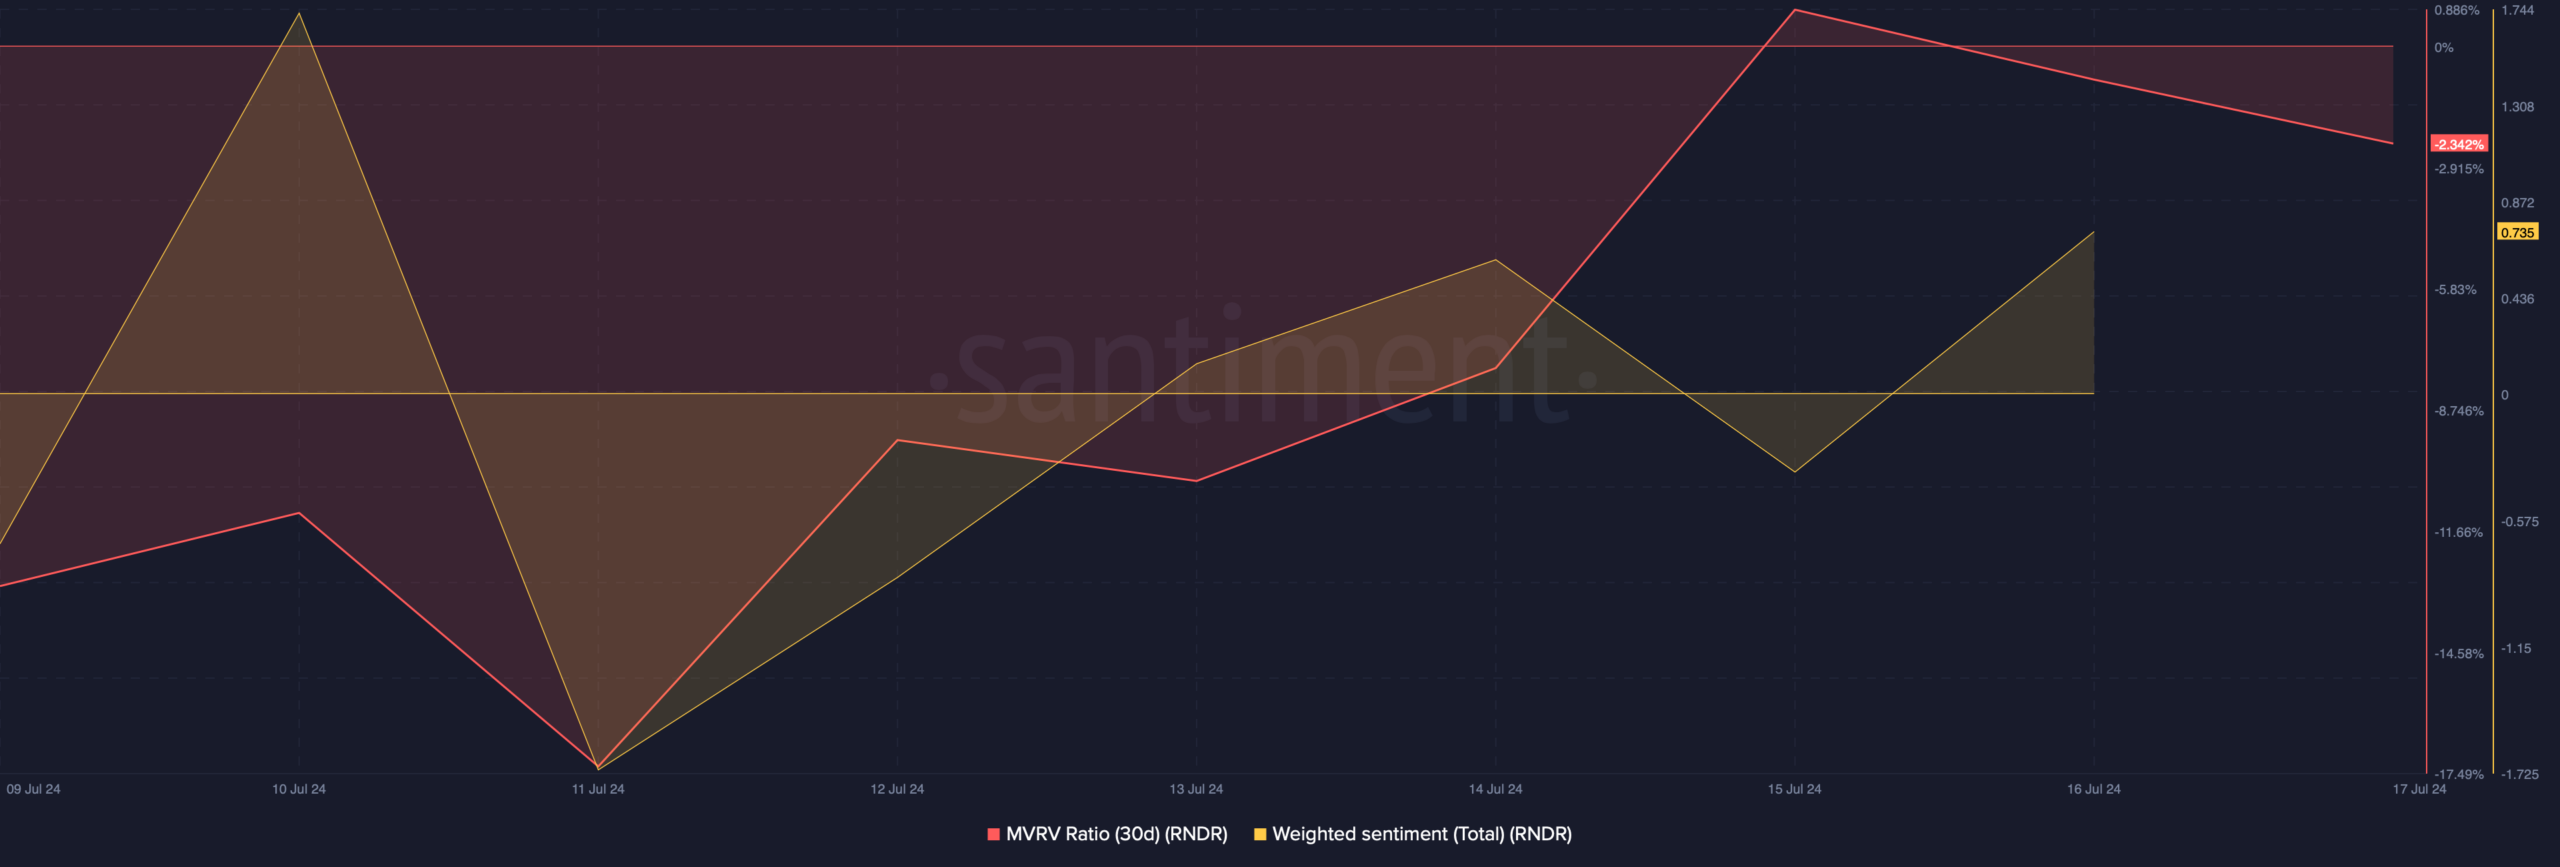
Source: Santiment
AMBCrypto then took a look at the token’s daily chart to better understand which way it’s headed. The technical indicator Relative Strength Index (RSI) registered a downtick, hinting at a continued price drop.
However, as per the Bollinger Bands, RNDR was testing its 20-day Simple Moving Average (SMA) resistance.
Read Render [RNDR] Price Prediction 2024-25
A breakout above that level could initiate a bull rally. There were chances of a successful breakout as the MACD displayed a bullish crossover.
If that happens, then RNDR might soon reach $7.72 before it targets $11.
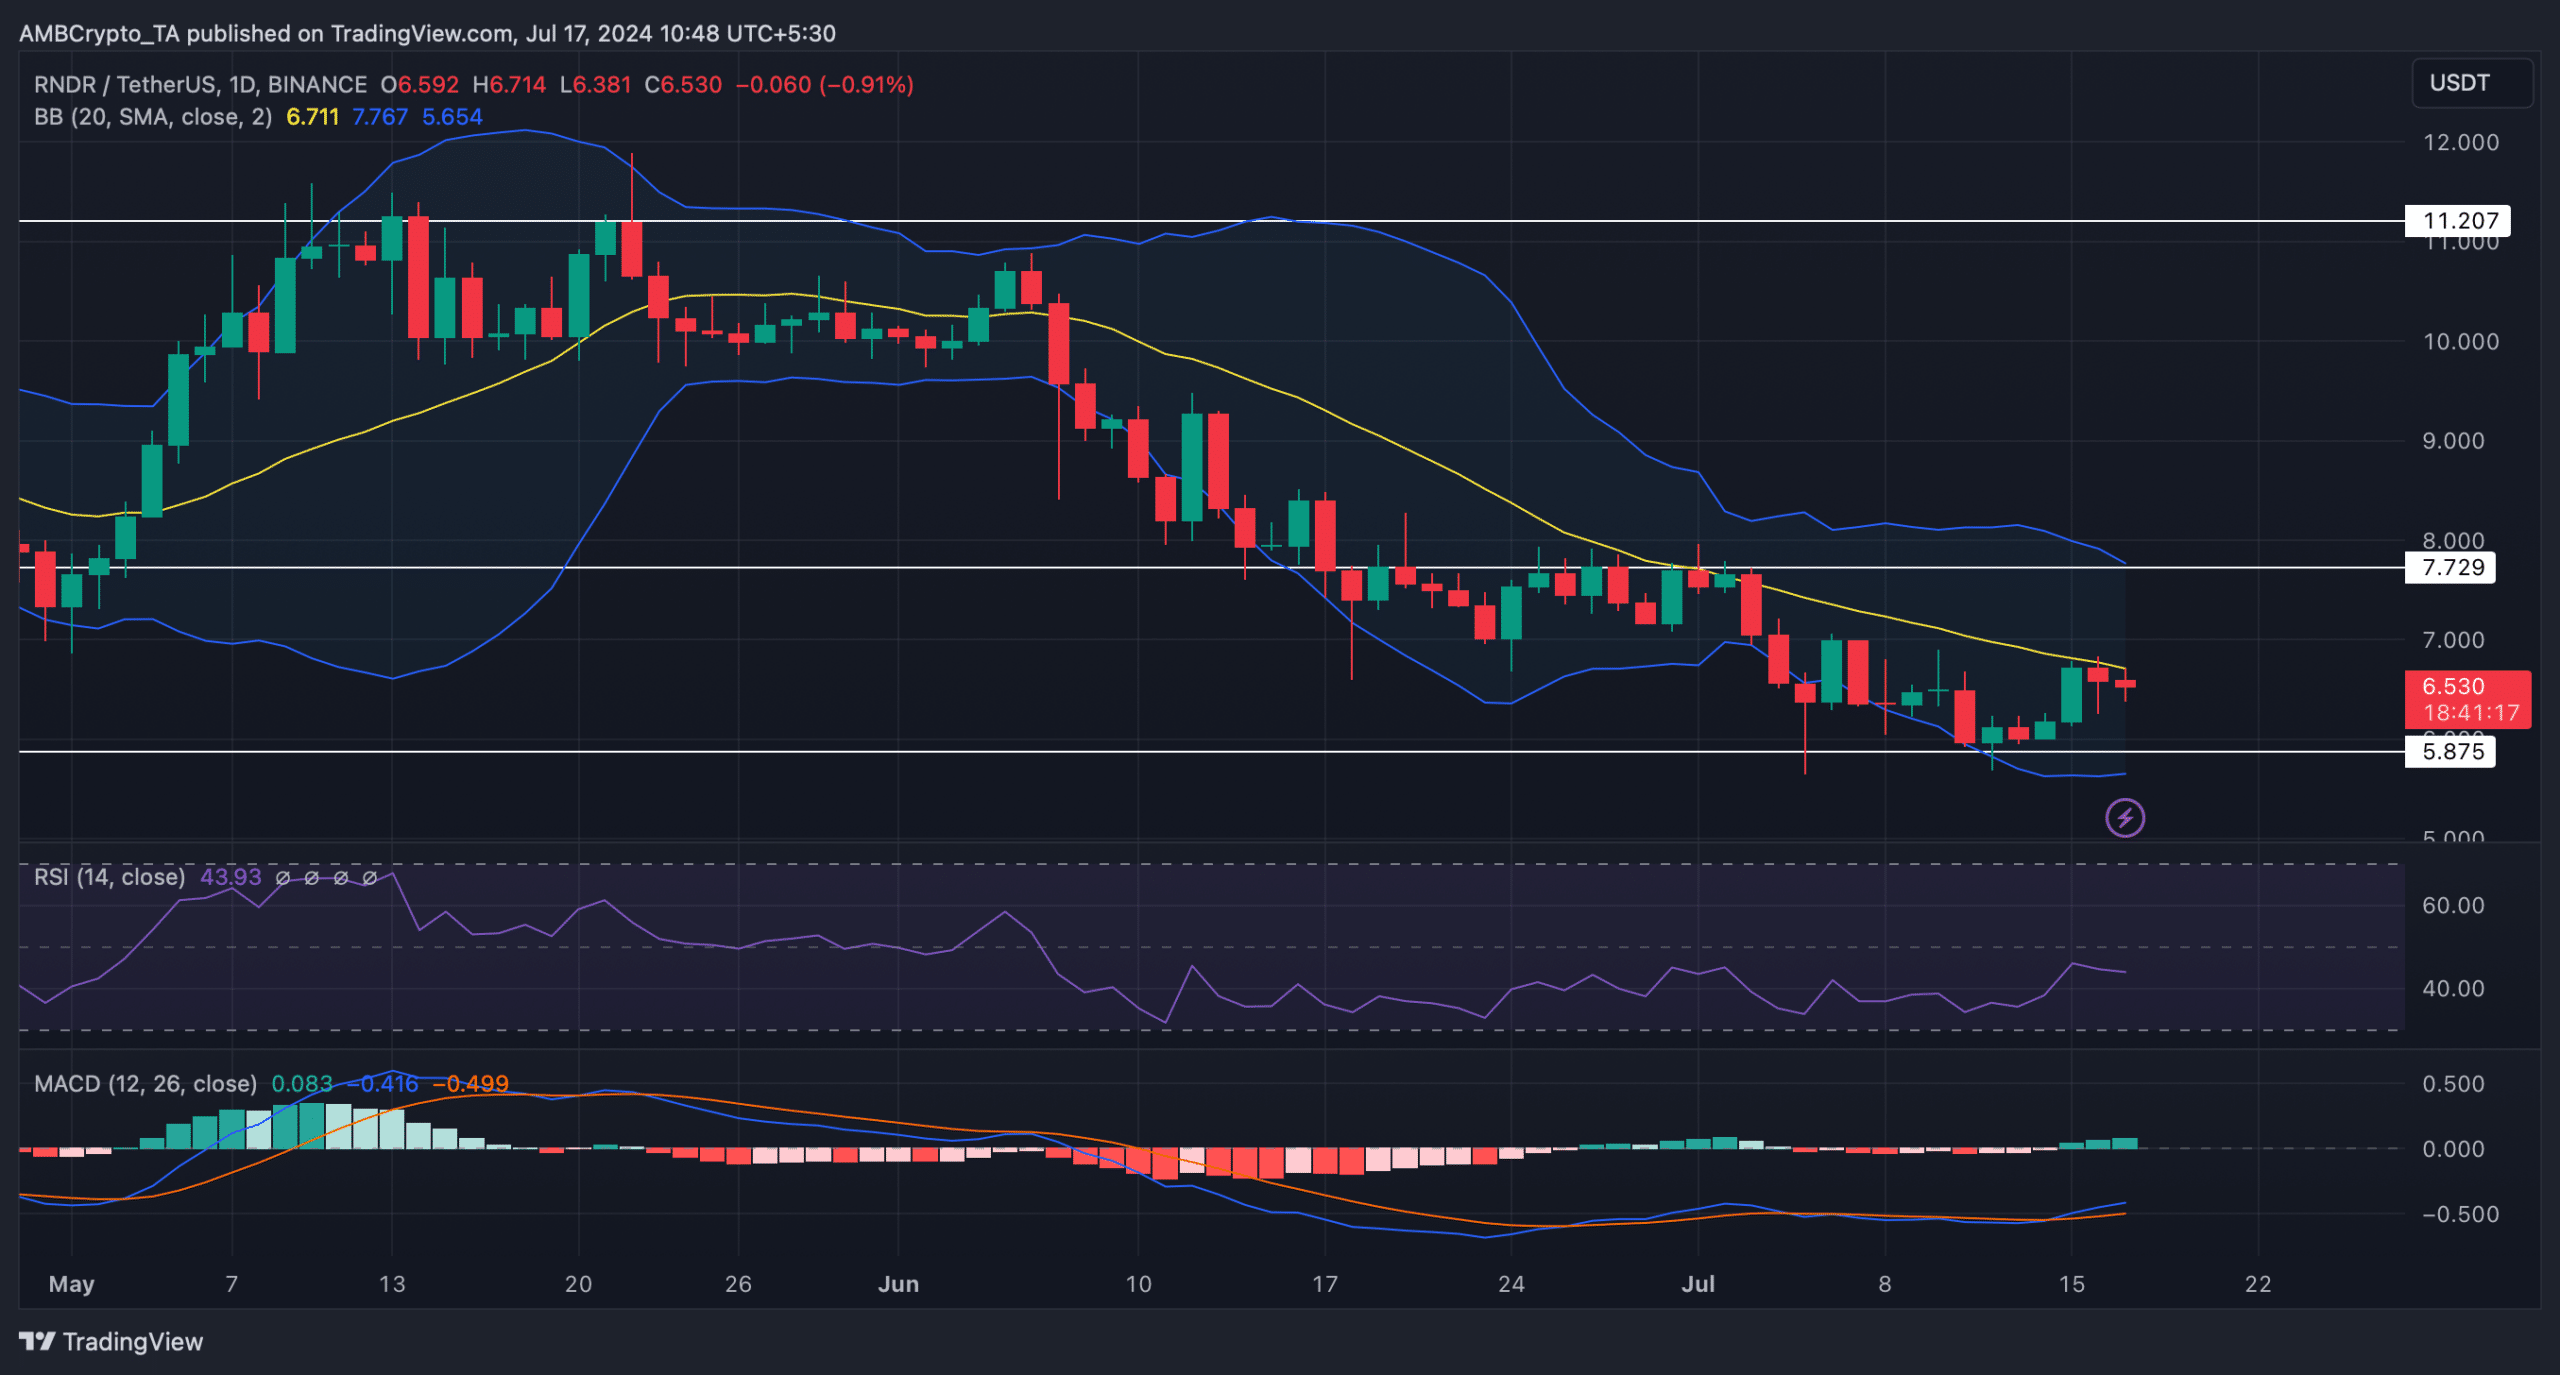
Source: TradingView


