Is Aptos over-extended or can we prepare for the next leg upward?

Disclaimer: The information presented does not constitute financial, investment, trading, or other types of advice and is solely the writer’s opinion.
- Aptos has retested a 4-hour bullish order block.
- A breakout past $19-$20 could see APT register massive gains.
Aptos has registered gains of 18% within 12 hours to reach $18.4 in the early hours of February 2. Since then, some lower timeframe consolidation was seen- but was this consolidation or distribution?
Is your portfolio green? Check the Aptos Profit Calculator
Bitcoin has performed well in recent hours and has defended $22.3k-$22.5k over the past two weeks. Until this area is flipped to resistance, the bias would remain bullish for BTC.
Meanwhile, Aptos showed contracting Open Interest despite the swift gains from $15.8. Was this reason for investors to worry?
Two sets of Fibonacci extension levels show $19 and $22 as imminent resistance
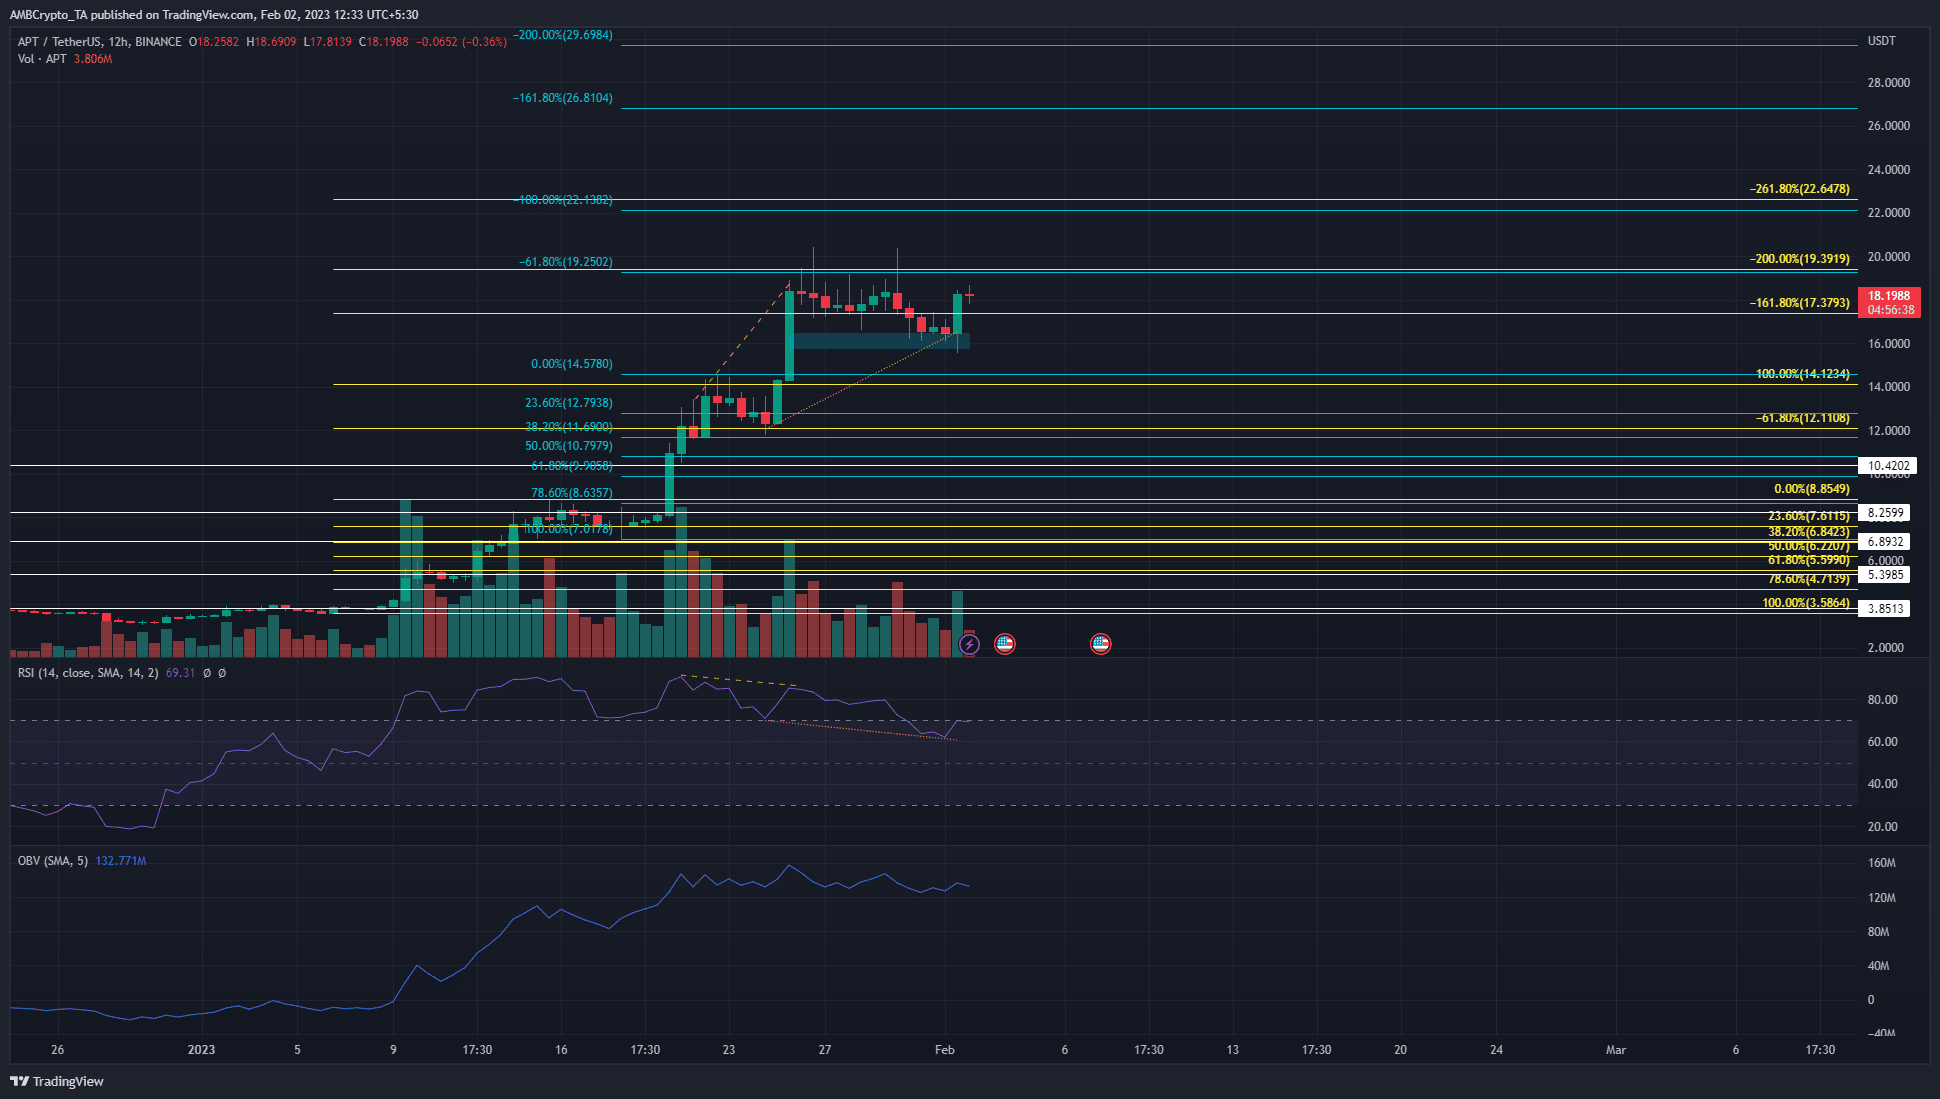
Since Aptos does not have historical data above the $20.4 mark, traditional support and resistance levels can not be plotted. The relatively small amount of price action above the $18 mark also makes it harder for longer-term buyers to set bids.
The $15.8-$16.4 area highlighted in cyan was a bullish order block from January 25. It was retested in recent hours and the price has bounced to reach $18.2 at the time of writing.
To the north, the pool of liquidity in the $19-$20 region is likely to be filled with sell orders. A session close above $20.4 and a retest of this zone can also offer a buying opportunity.
Read Aptos’s Price Prediction 2023-24
The Fibonacci levels are plotted based on the move upward from $3.58 to $8.85 in yellow. The 200% and 261.8% extension levels lie at $19.39 and $22.64.
In cyan, another set of Fibonacci extension levels is plotted. They show resistance at $22, $26.8, and $29.69. Hence these are levels where buyers from lower levels can look to take a profit at.
Open Interest takes a dip, could this stall the rally
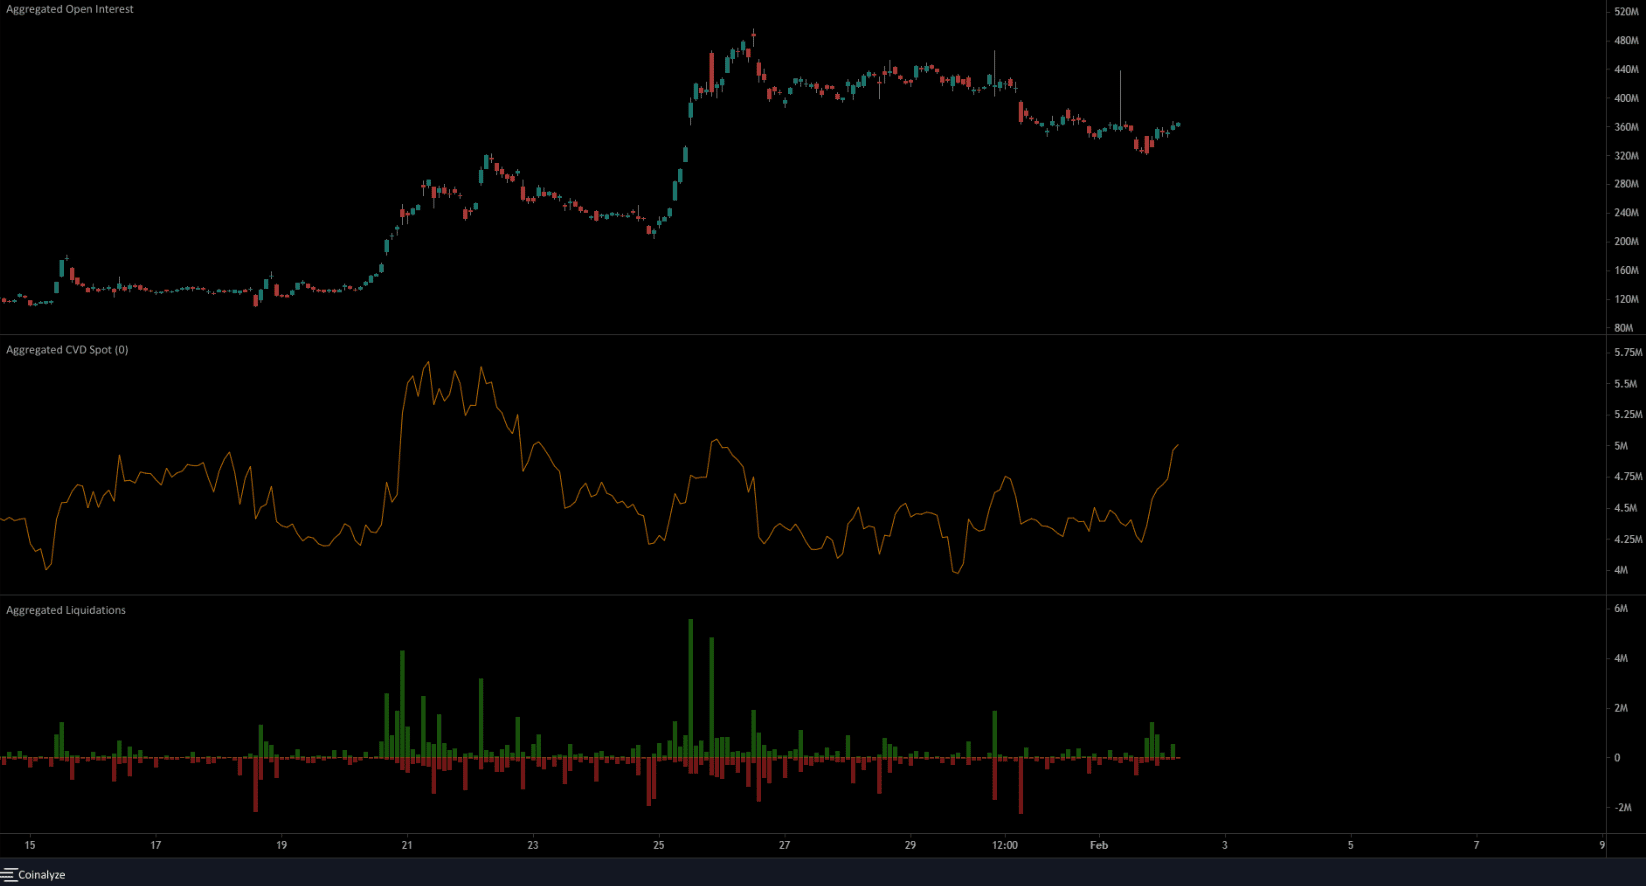
Since January 26, both the price and the Open Interest have been in a lower timeframe downtrend. The receding OI meant long positions were discouraged and signaled near-term bearishness. However, the higher timeframe market structure was strongly bullish. This was reinforced further by the bounce from the $15.8 order block.
While OI trundled lower, the past couple of days saw the spot CVD form a large upward spike. This indicated a strong inflow of buying. At the same time, some short positions were liquidated. They measured $3 million in the span of six hours on February 1.