
7 companies rush to launch XRP ETFs: Analyst hails ‘good sign’

- The Bitcoin Rainbow Chart suggested that BTC was “still cheap.”
- Selling pressure was rising on BTC, which could cause trouble.
Sentiment around Bitcoin [BTC] remained bullish as the king of cryptos managed to trade well above the $61k mark. In fact, if the latest data is to be considered, then things might get even better.
This was the case as there were high chances of a golden crossover, which could push the coin’s price further up.
Bitcoin’s upcoming golden crossover
CoinMarketCap’s data revealed that BTC bulls dominated last week as the coin’s price surged by more than 7%. At the time of writing, BTC was trading at $64,003.47 with a market capitalization of over $1.2 trillion.
While the bulls led the market, Ali, a popular crypto analyst, posted a tweet revealing an interesting development. As per the tweet, BTC’s MVRV ratio and its 365-day simple moving average (SMA) were on the verge of a crossover.
If that happens, then BTC might experience yet another bull rally, which can push the coin’s price further up.

Source: X
Therefore, AMBCrypto investigated further to find out the odds of the golden crossover happening. As per our analysis of Glassnode’s data, BTC’s price finally touched its possible market bottom, according to the Pi Cycle Top indicator.
In case of a golden crossover, then BTC might soon rally to its possible market top of $103k.
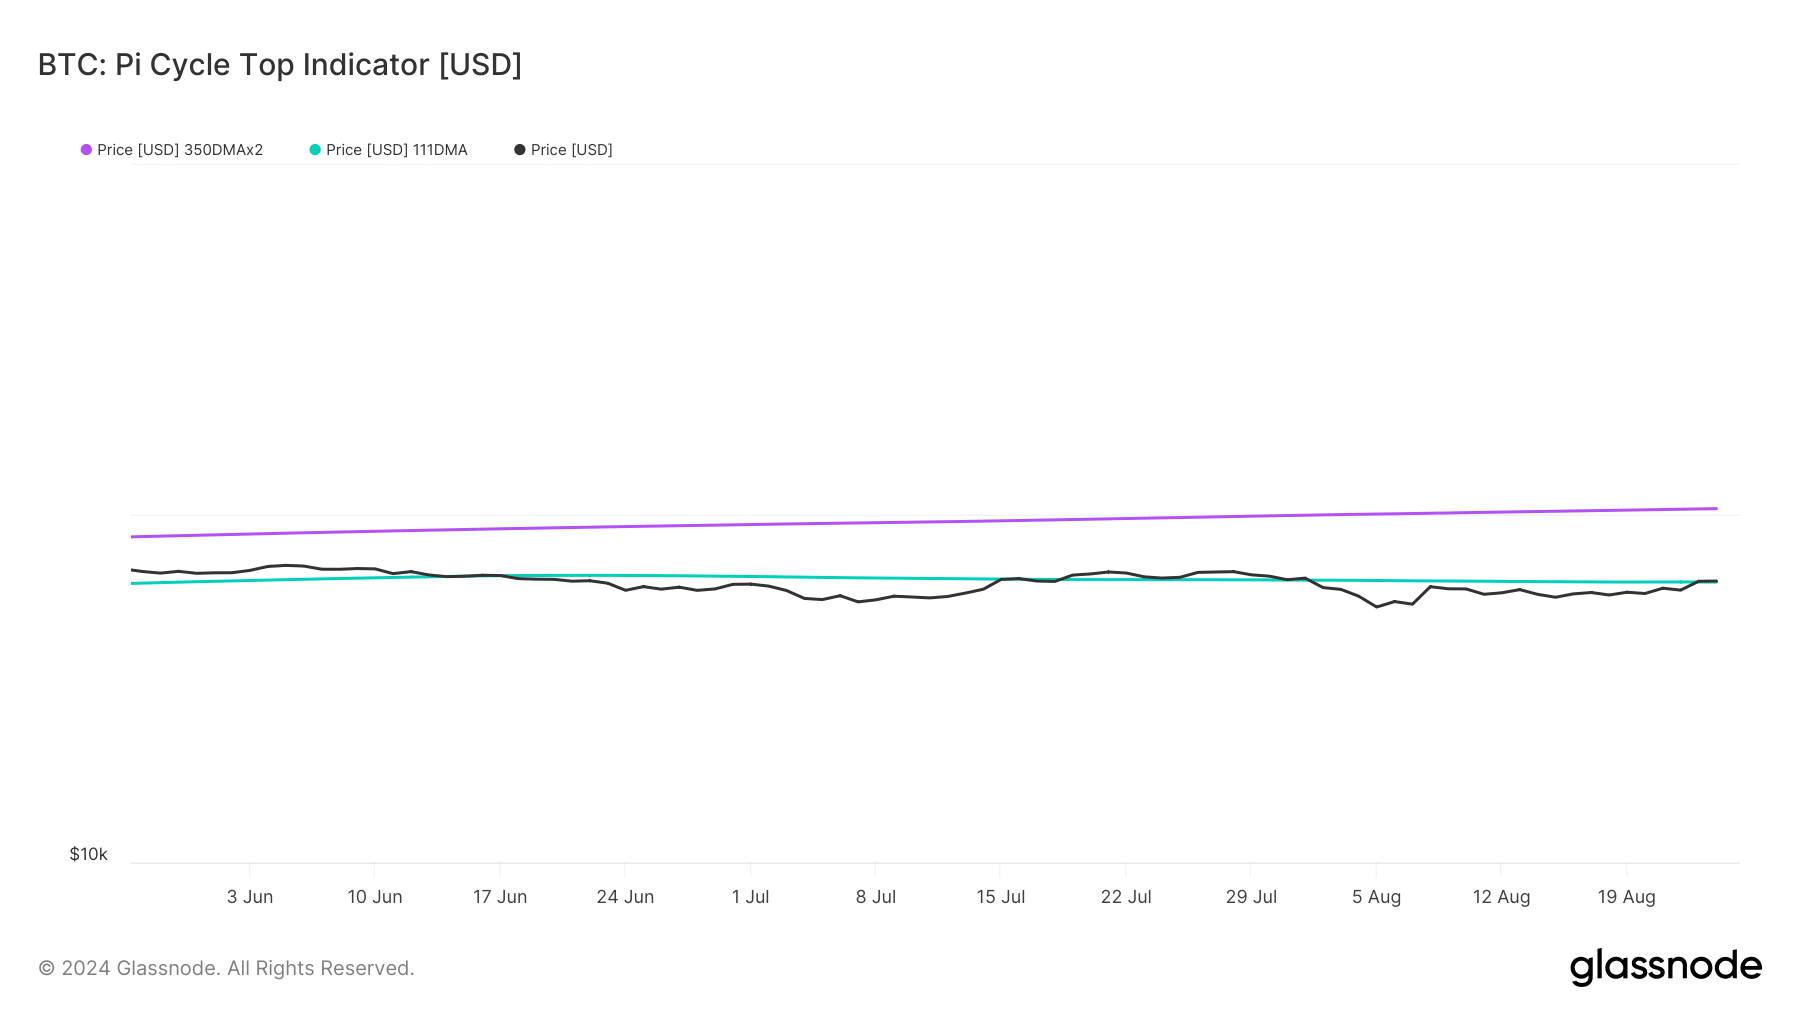
Source: Glassnode
BTC’s road ahead
Our analysis of CryptoQuant’s data revealed that BTC’s exchange reserve was increasing, meaning that selling pressure was rising. Apart from this, BTC’s active addresses dropped by -39.25% compared to yesterday.
The total number of transactions also decreased by -25.39% compared to yesterday. Both of these metrics looked bearish on Bitcoin.
Things in the derivatives market also looked pretty bearish. This was evident from its red taker buy/sell ratio, suggesting that selling sentiment was dominant in the futures market.

Source: CryptoQuant
However, a look at the Bitcoin Rainbow Chart pointed out that there might still be time for investors to accumulate more. The chart revealed that at press time, BTC’s price was in the “still cheap” zone.
This clearly meant that investors might consider buying the coin before its price takes off.

Source: Blockchaincenter
We then assessed the coin’s daily chart to find out what market indicators suggested. The Relative Strength Index (RSI), after a sharp uptick, took a sideways path.
Read Bitcoin’s [BTC] Price Prediction 2024-25
BTC’s Chaikin Money Flow (CMF) also followed a similar trend, hinting at a few slow moving days.
In case of a golden crossover, BTC’s might first target $68k before it eyes its possible market top of $103k. However, if the bears take over, then the coin might drop to $54k again.
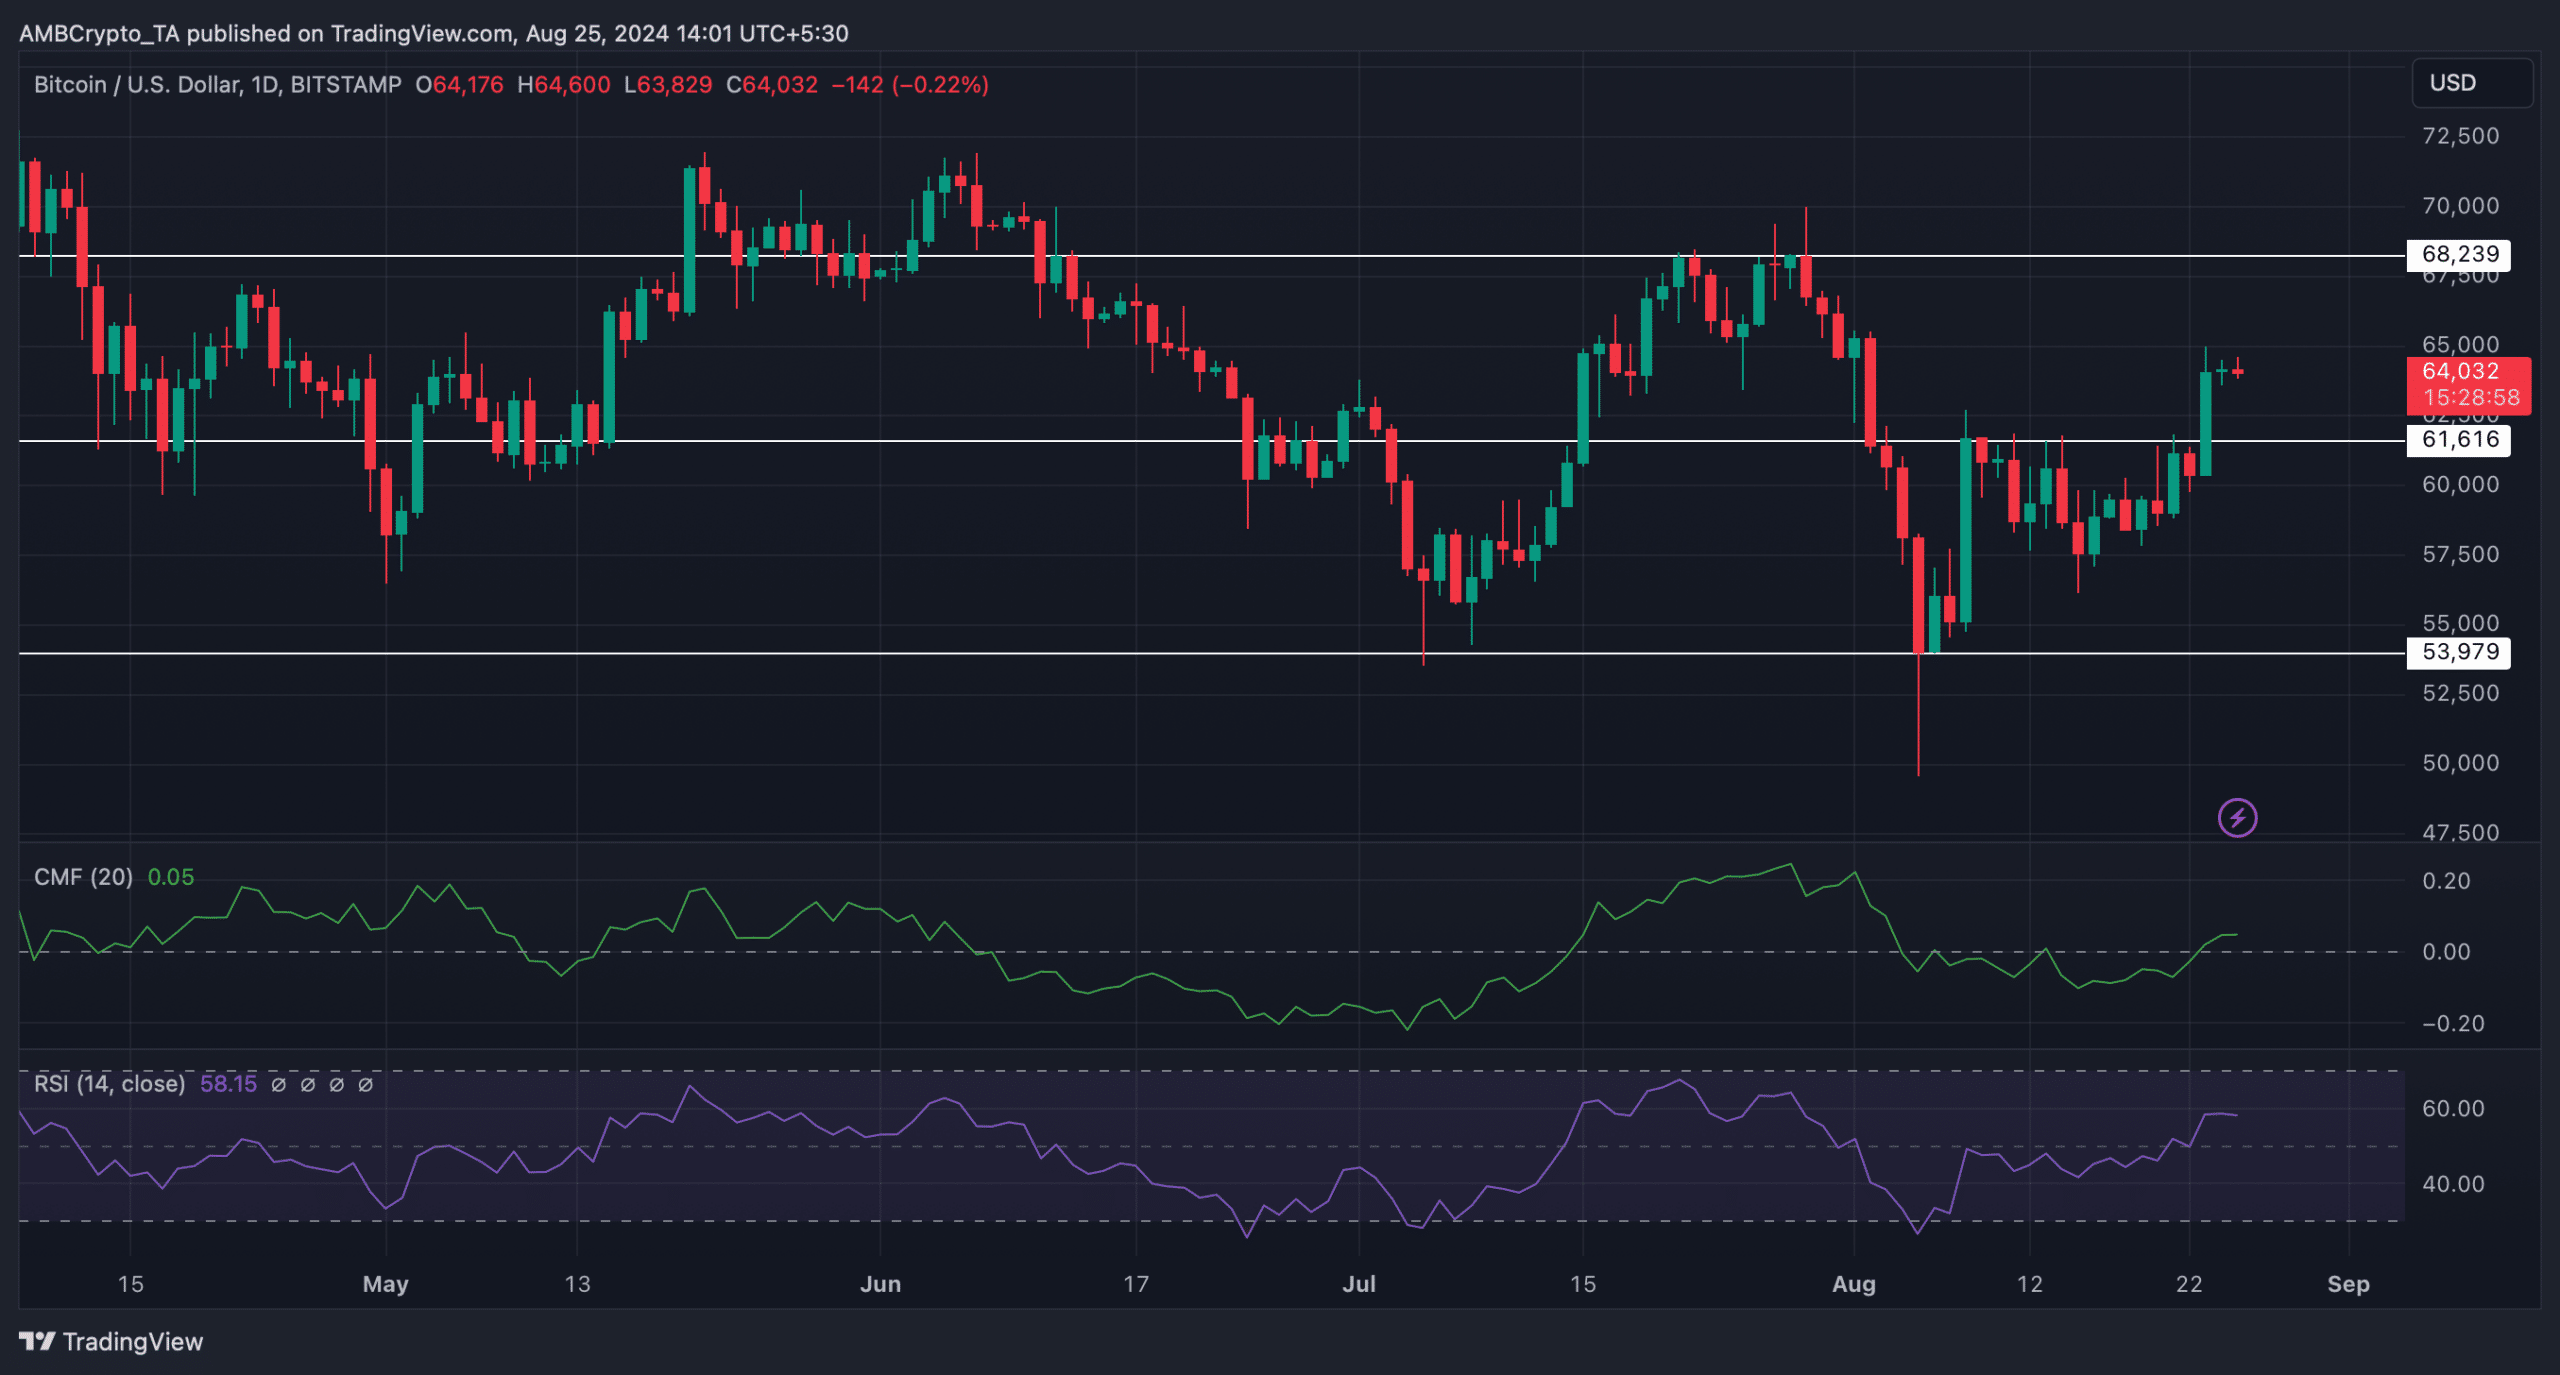
Source: TradingView


