Is Bitcoin due for a price correction?
If history is to be believed, Bitcoin's Puell Multiple is showing signs of a price drawback.

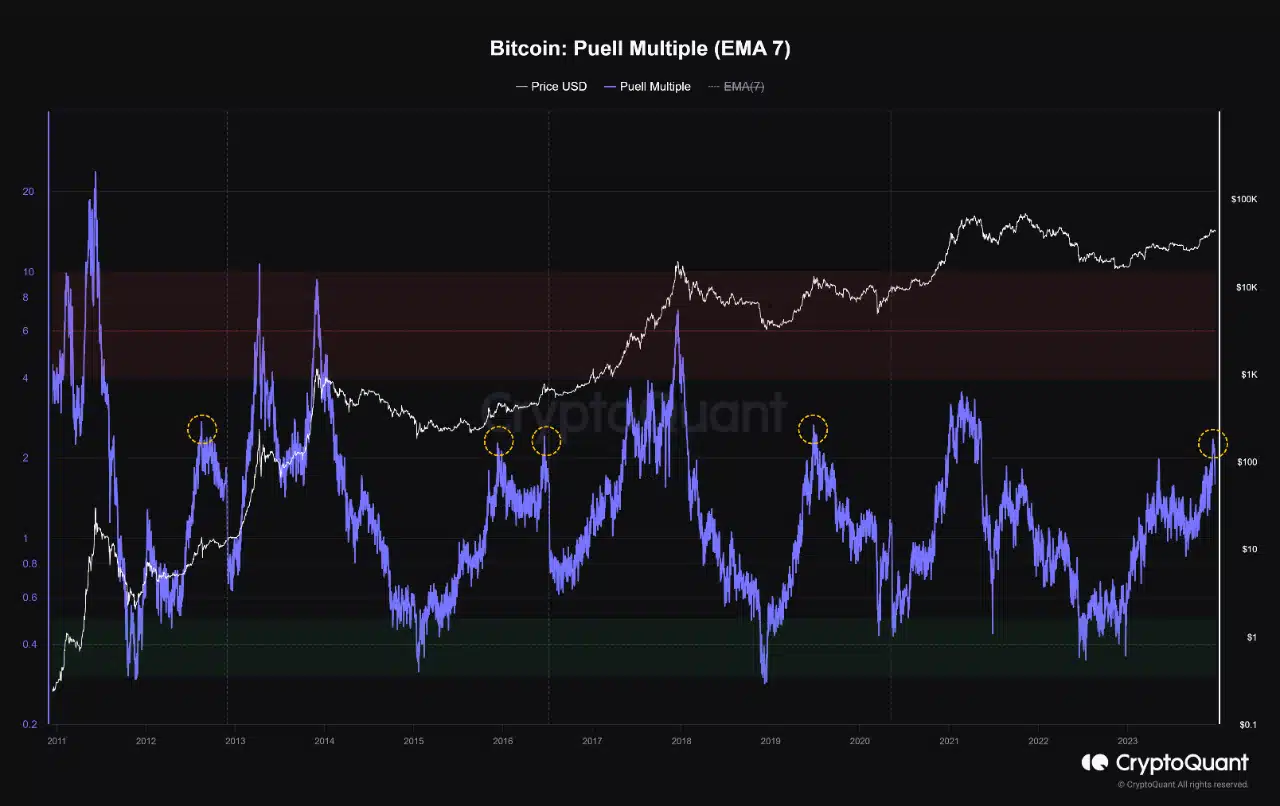
- Bitcoin’s Puell Multiple has risen to levels that were followed by price corrections in 2012, 2016, and 2019.
- Key momentum indicators have shown that Bitcoin’s accumulation persisted.
Bitcoin’s [BTC] Puell Multiple has climbed to resistance levels recorded in 2012, 2016, and 2019, suggesting that the coin’s price might experience a drawback, CryptoQuant analyst Joao Wedson has found in a new report.
BTC’s Puell Multiple measures the ratio of the daily value of the coin issuance in US dollars divided by its 365-day moving average.
The metric focuses on measuring miner profitability by comparing their daily earnings from newly mined coins to their average earnings over the past year.
At press time, BTC’s Puell Multiple was 1.56. According to Wedson, at this value:
“We are witnessing the Puell Multiple reaching values that were significant resistance points in previous years, notably in 2012, 2016, and 2019. These periods were marked by a significant reversal in Bitcoin prices.”
Wedson opined that this historical performance might play out as the coin’s Puell Multiple increases.
The bulls versus the bears
As positive sentiment waned in the past two weeks, BTC’s price has traded within a narrow range, facing strong resistance at $42,500.
BTC, which exchanged hands above $44,000 on the 10th of December, has since recorded a 5% price decline, according to data from CoinMarketCap.
The start of the price decline coincided with when BTC’s MACD line (blue) crossed below its trend line. Readings observed from the coin’s Moving Average Convergence Divergence showed that the indicator has since posted only red histogram bars.

A downward intersection of an asset’s MACD line with its trend line is considered a bearish signal. It suggested that the short-term moving average has fallen above the longer-term moving average, indicating the re-emergence of bears.
While the market remained plagued by bearish sentiments, coin accumulation persisted among daily traders, albeit of low volume.
Read Bitcoin’s [BTC] Price Prediction 2023-24
As of this writing, the coin’s Relative Strength Index (RSI) and Money Flow Index (MFI) were 54.46 and 62.73.
While the values of these indicators have plummeted in the past few weeks, they remain positioned above their center lines. This suggested that the recent spike in profit-taking activity has not totally stopped investors from buying BTC.