
Ripple CEO warns of Deepfake XRP scams as token surges to $3.10, crashes

- VanEck analysts believe that BTC could be set for a strong recovery
- Analysts cited strong network activity and a decline in funding costs in BTC Futures
According to VanEck’s monthly report on Bitcoin [BTC], the world’s largest digital asset has shown remarkable resilience lately. It is, in fact, now mirroring its earlier market recoveries, it said.
VanEck’s analysts, Mathew Sigel and Nathan Frankovitz, noted that BTC’s strong network activity and a drop in future funding costs could be signs of a likely strong recovery.
“Bitcoin network activity stayed robust with an 83% surge in Ordinals inscriptions, while funding costs for Bitcoin futures dropped, reflecting a risk appetite seen in earlier market recoveries.”
BTC funding cost mirrors May and July recoveries
Notably, BTC funding rates – Fees paid by traders to hold perpetual futures contracts – dropped to similar levels during the May and July recoveries.
“Over the past 30 days, the 7 DMA annualized cost of funding Bitcoin futures has dropped from ~11.6% to ~8.8% for a relative decline of ~24%. These levels indicate a risk appetite similar to those seen during market recoveries following 20%+ BTC price drops in early May and July of this year.”
Despite the positive set-up for BTC, the recent decline in August slashed addresses with profits by about 9%. Overall, BTC users with unrealized profits were 84%, as per the report. The rest of the users in losses were mostly short-term investors.
However, the analysts noted that the recent drawdowns were normal retracements during BTC bull markets.
Besides, pressure from BTC miners has been tapering off, as noted by the decline in miners’ sell-offs.
“Transfer volumes from miners to exchanges fell 21% over the past 30 days, suggesting stabilization from miners after their post-halving selling increased significantly in June and July.”
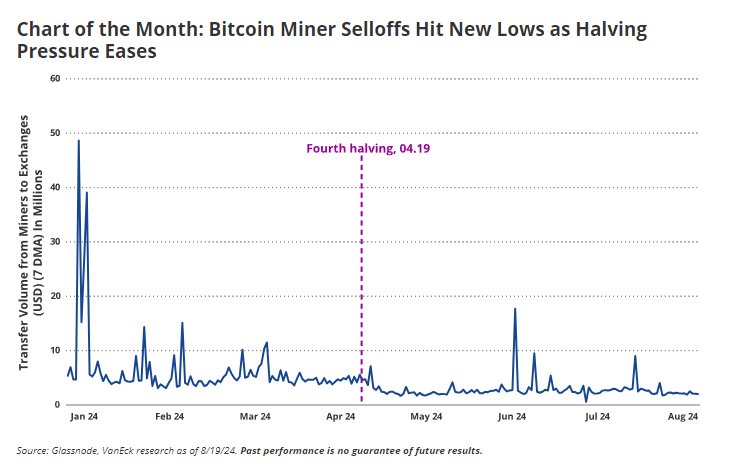
Source: VanEck
At the time of writing, Bitcoin’s higher timeframe chart was bullish after mounting above the short-term supply area at $63k and reclaiming the 200-day SMA (Simple Moving Average).
![Bitcoin [BTC]](https://ambcrypto.com/wp-content/uploads/2024/08/BTCUSD_2024-08-24_10-22-17.png)
Source: BTC/USD, TradingView


