Is Bitcoin ready for a new breakout? Choppiness index suggests…
The boring and choppy BTC market could end soon, if THESE key metrics are validated.

- Bitcoin could rally higher above the $90K-108K range.
- The choppiness index and reduced sell pressure from long-term holders reinforced the breakout prospects.
Bitcoin [BTC] appeared set for a renewed uptrend, with key on-chain indicators suggesting a decisive breakout from the $90K-108K range is imminent.
One of the metrics, the choppiness index (CI), which gauges BTC price action relative to its price consolidation, implied that the ongoing sideways movement was about to end.
In fact, on-chain analyst Checkmate reinforced this outlook and stated,
“The #Bitcoin Choppiness Index is fully gassed, and ready to trend. As covered back in late-Nov, the thesis was we likely had several weeks of chopsolidation before properly trending away from the $100k level. We’re there.”
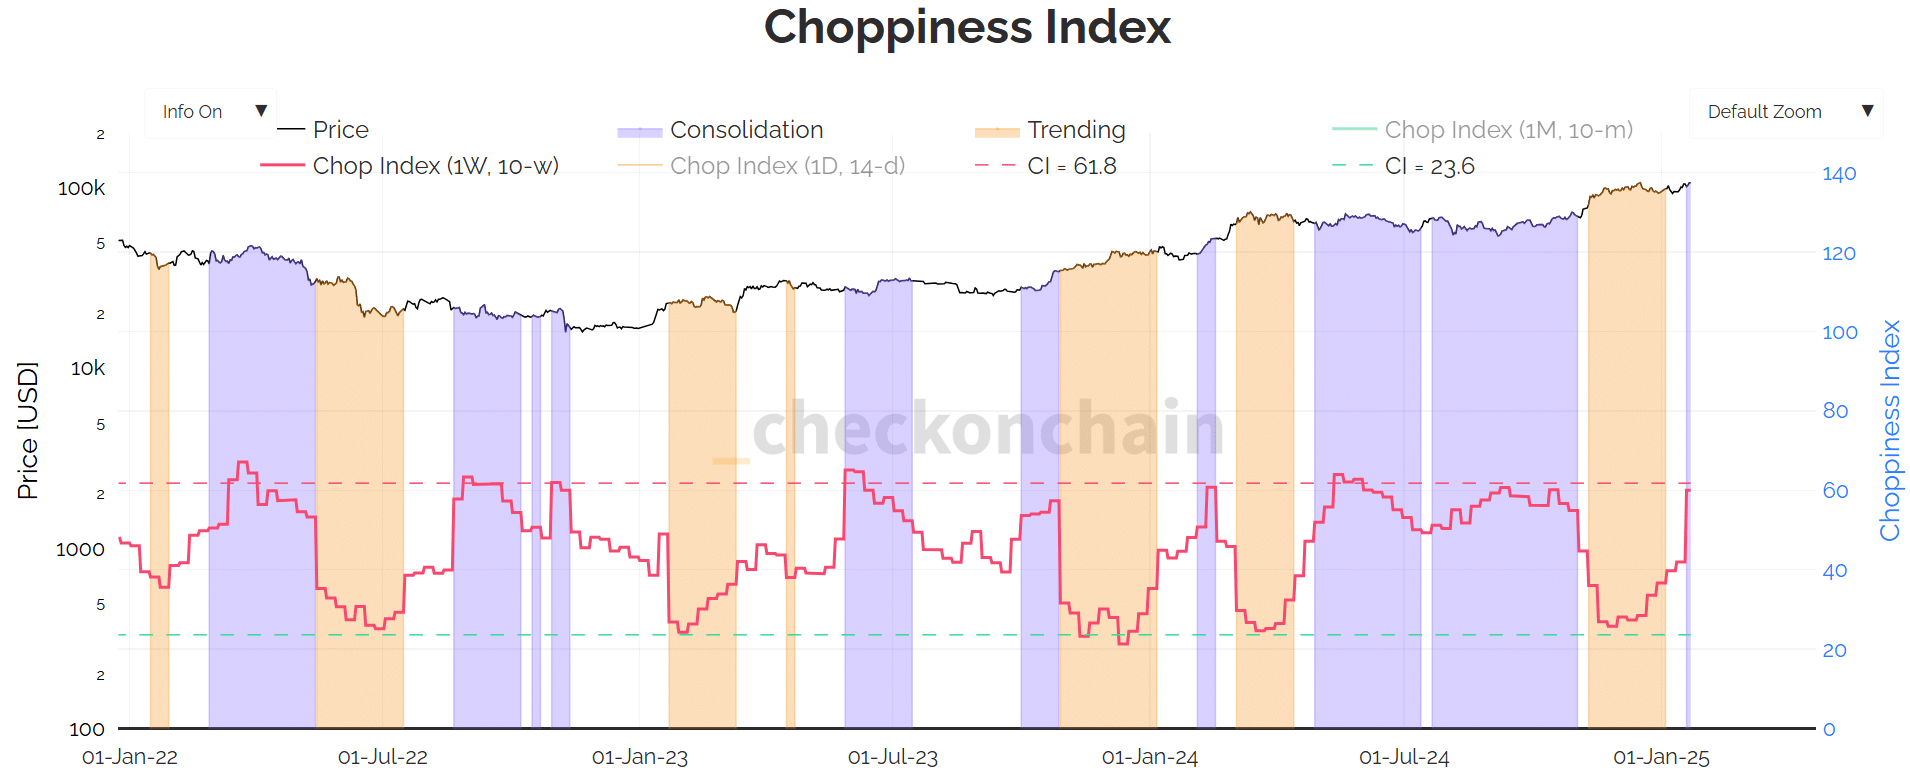
Historically, per the attached chart, a sharp uptick in the weekly CI (red) signaled consolidation (purple blocks).
On the contrary, a drop in CI coincided with sharp uptrends or downtrends (orange blocks). With the CI at an inflection point after a recent surge, a retreat would imply a renewed BTC uptrend or downtrend.
Given the new pro-crypto Trump administration, the market leaned towards the former (likely uptrend).
BTC supply pressure eases
Another key bullish indicator was easing BTC supply pressure from long-term holders (LTH). In its latest “weekly on-chain” report, Glassnode highlighted that selling pressure from LTH has significantly decreased.
“Sell-side pressure from long-term investors has also declined, alongside volumes deposited to exchanges for sale.”
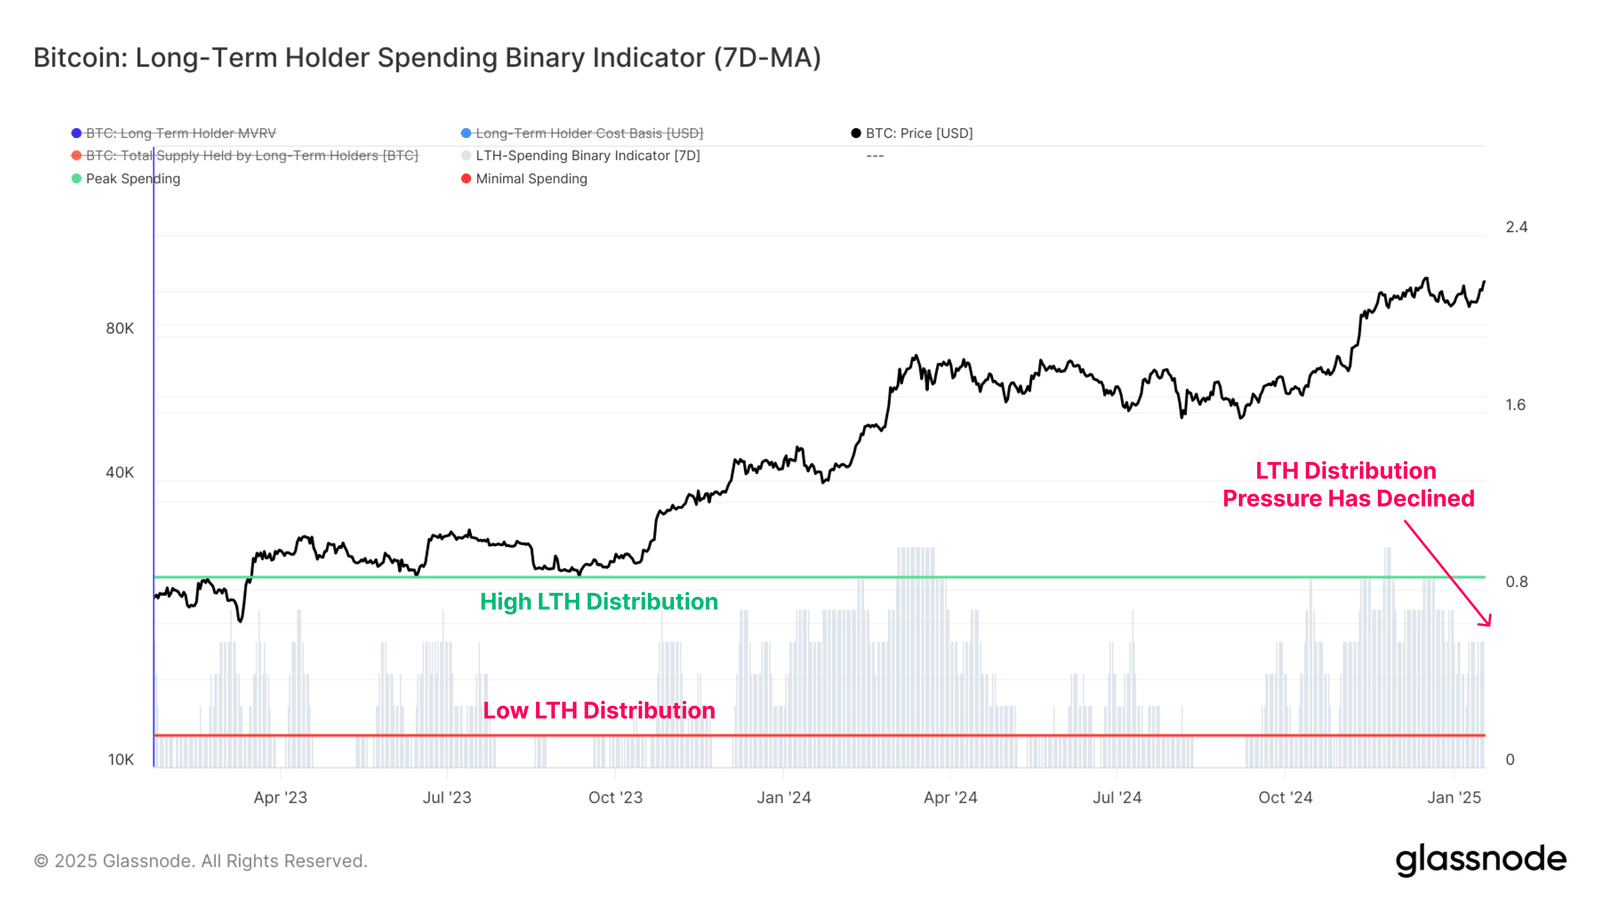
The analytics firm noted that profit-taking from this cohort hit $4.5B in December but has dropped to below $400M in January. As a result, the trend leaned towards renewed BTC accumulation.
“Currently, the total LTH supply is starting showing signs of growth back to the upside, suggesting that accumulation and HODLing behaviour is now larger than distribution pressure for this cohort.”
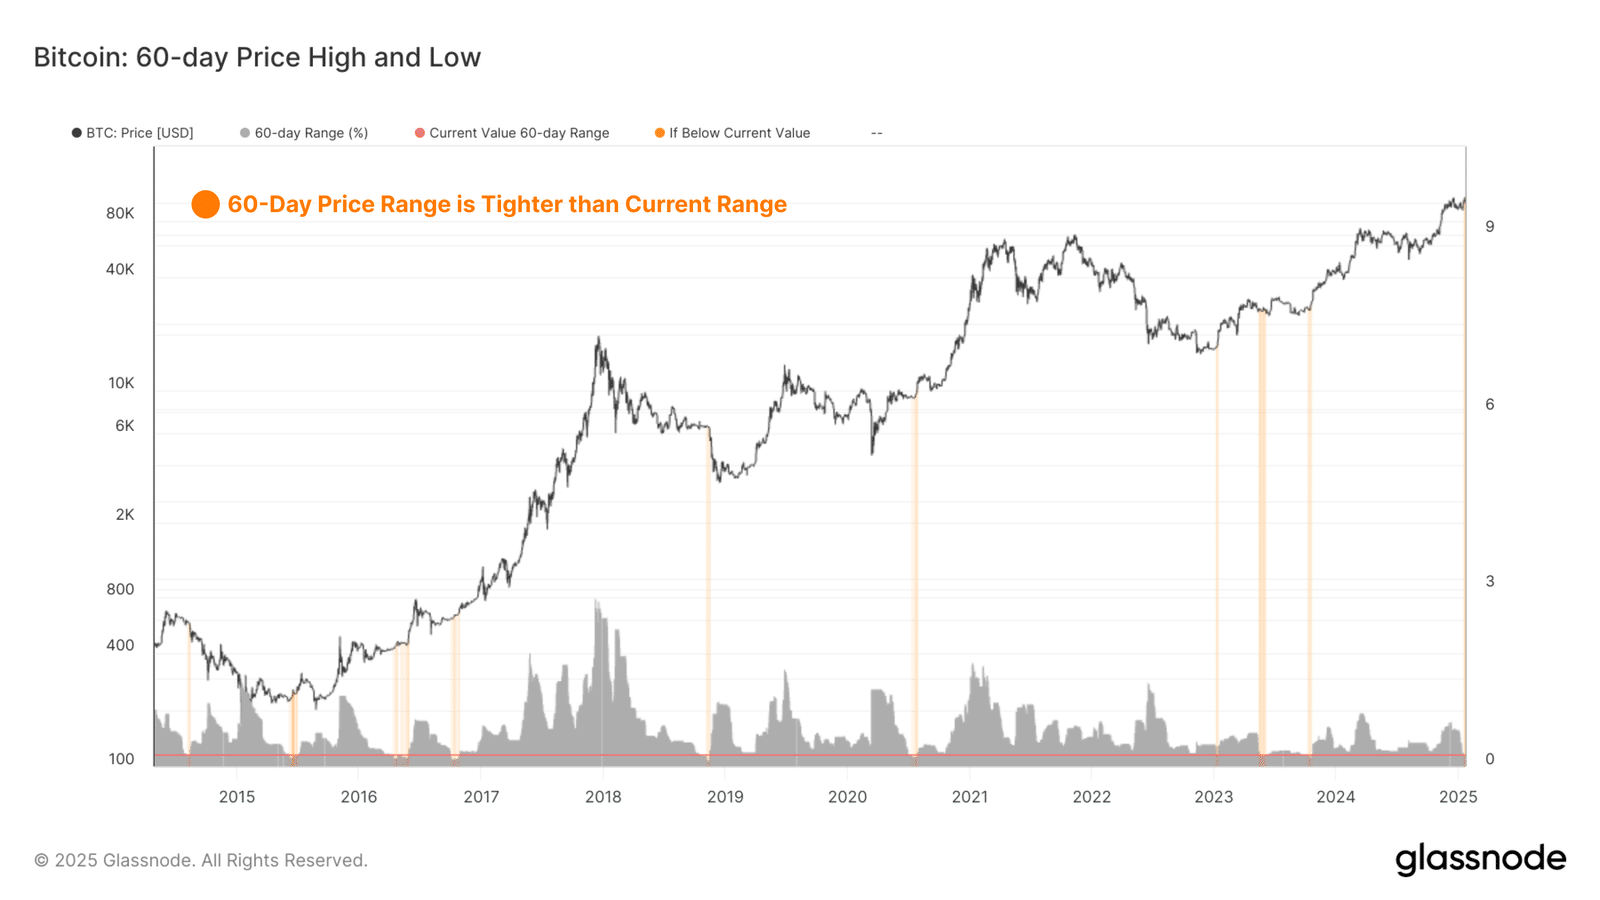
Finally, the average price range for a 60-day period also signaled a potential breakout.
Glassnode added that the current sideways structure was tighter than the historical 60-day price range, which always precedes bullish breakouts.
“The chart highlights periods which have a tighter 60 day price ranges than the current trading range. All of these instances have occurred prior to a significant burst of volatility, with the majority being in early bull markets, or prior to late stage capitulations in bear cycles.”
Taken together, the above metrics revealed that a strong uptrend above $100K could be on the cards. However, it remains to be seen how macro updates and Trump administration announcements will impact this outlook.


