
- Bitcoin’s price dropped by over 2% last week.
- A key indicator pointed out that BTC was near a market bottom.
Bitcoin [BTC] bears stayed ahead of the bulls last week as the king of cryptos’ price registered a decline. However, if the latest data is to be considered, BTC’s path ahead might not have many break-throughs.
Let’s have a closer look at BTC’s state to see what the upcoming week might be.
Bitcoin bears might take a break
CoinMarketCap’s data revealed that BTC’s price had dropped by more than 2% in the last seven days. The coin’s price turned bullish days after reclaiming $70k on the 24th of May.
At the time of writing, Bitcoin was trading at $67,674.15 with a market capitalization of over $1.33 trillion.
Nonetheless, the upcoming days might look different. Milkybull, a popular crypto analyst, recently posted a tweet highlighting an interesting development.
As per the tweet, from a short-term perspective, nothing is looking bearish, but rather it’s gathering momentum for the next move.
This was the case as BTC continued to trade above its crucial support at $66k. Moreover, the 13th consecutive positive ETF inflow was another added advantage for the bulls.
AMBCrypto’s analysis of CryptoQuant’s data revealed that BTC’s binary CDD was green. This meant that long-term holders’ movements in the last 7 days were lower than average. However, the rest of the metrics looked pretty bearish.
For example, BTC’s net deposit on exchanges was higher compared to the last seven-day average. Its aSORP was also red, meaning that more investors are selling at a profit. In the middle of a bull market, it can indicate a market top.

Source: CryptoQuant
Is there a bull rally around the corner?
Apart from this, BTC’s fear and greed index had a reading of 72 at press time, meaning that the market was in a “greed” phase. Whenever the metric hits that level, the changes of a price correction are high.
However, Glassnode’s data pointed out an indicator that hinted at a price pump.
BTC’s Pi Cycle Top indicator revealed that BTC’s price was just about to touch the 111-day moving average (MA). Therefore, the chances of a rebound are high after BTC touches that support level, which indicates a market bottom.
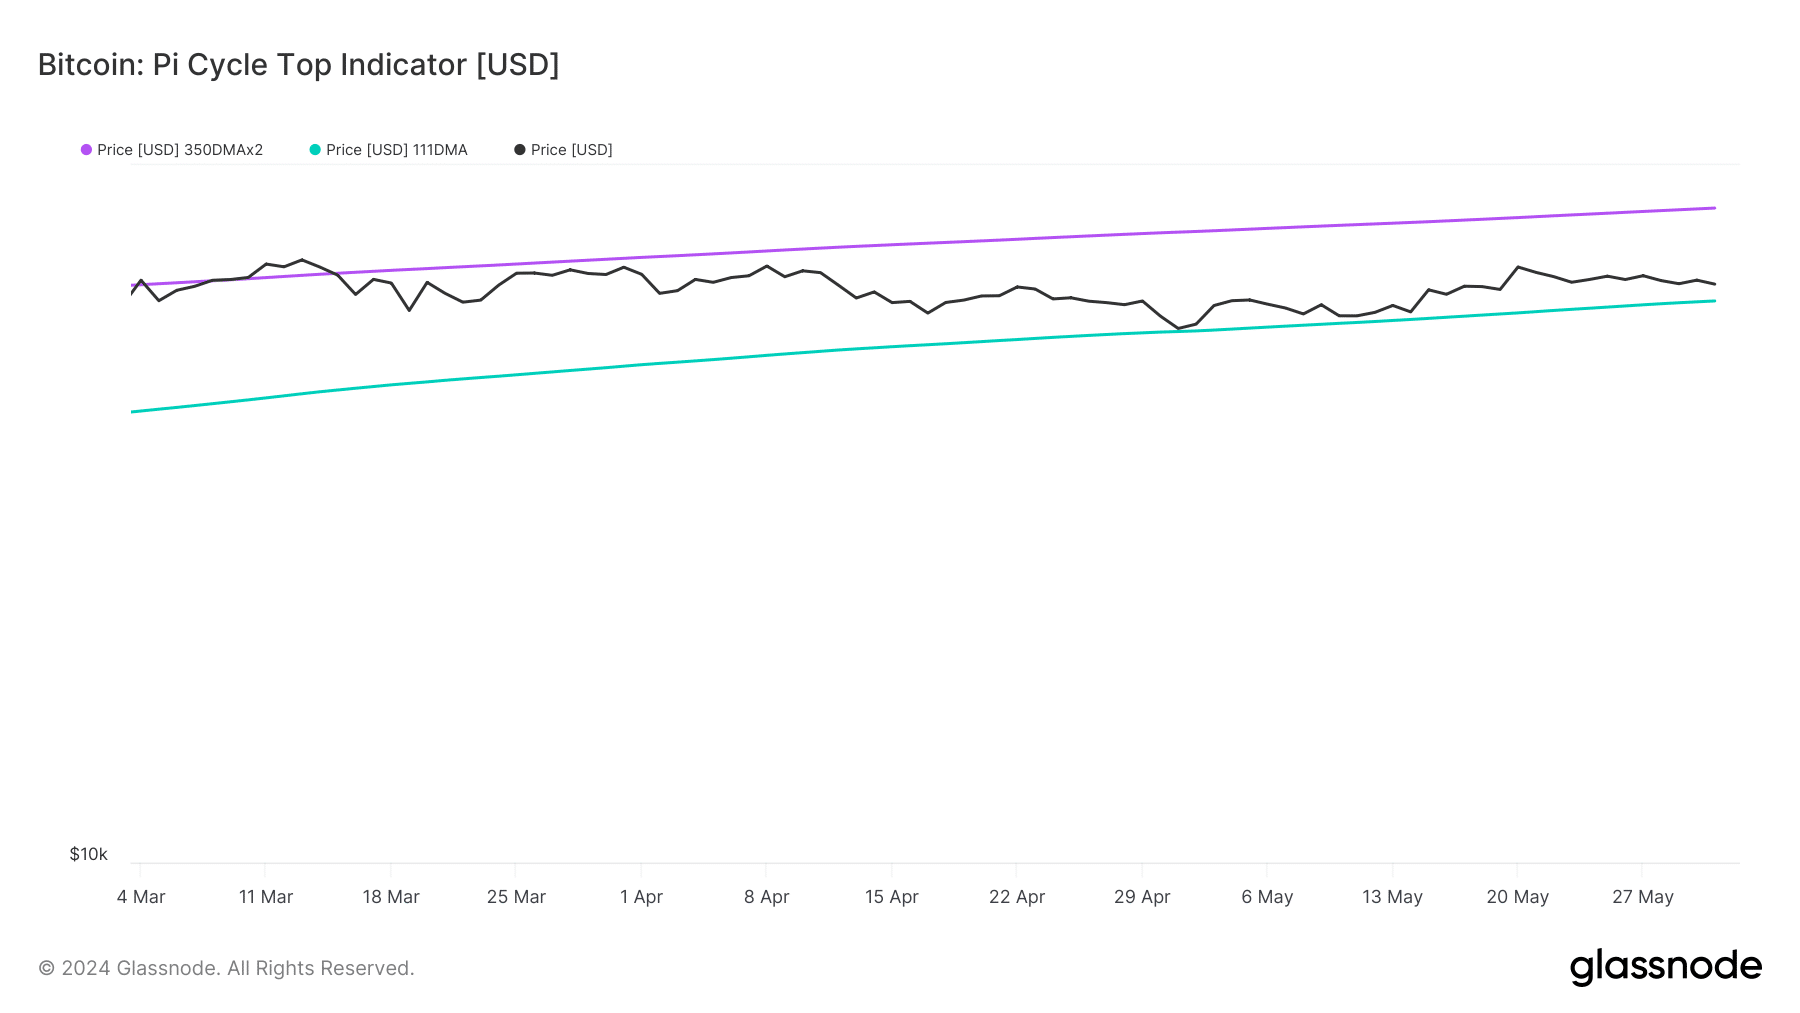
Source: Glassnode
Read Bitcoin (BTC) Price Prediction 2024-25
The possibility of BTC touching its support level seemed high as the coin’s Money Flow Index (MFI) registered a sharp decline. The king of cryptos’ Chaikin Money Flow (CMF) also followed a similar declining trend.
These indicators suggest that BTC might drop a bit more before it makes a comeback over the coming days.
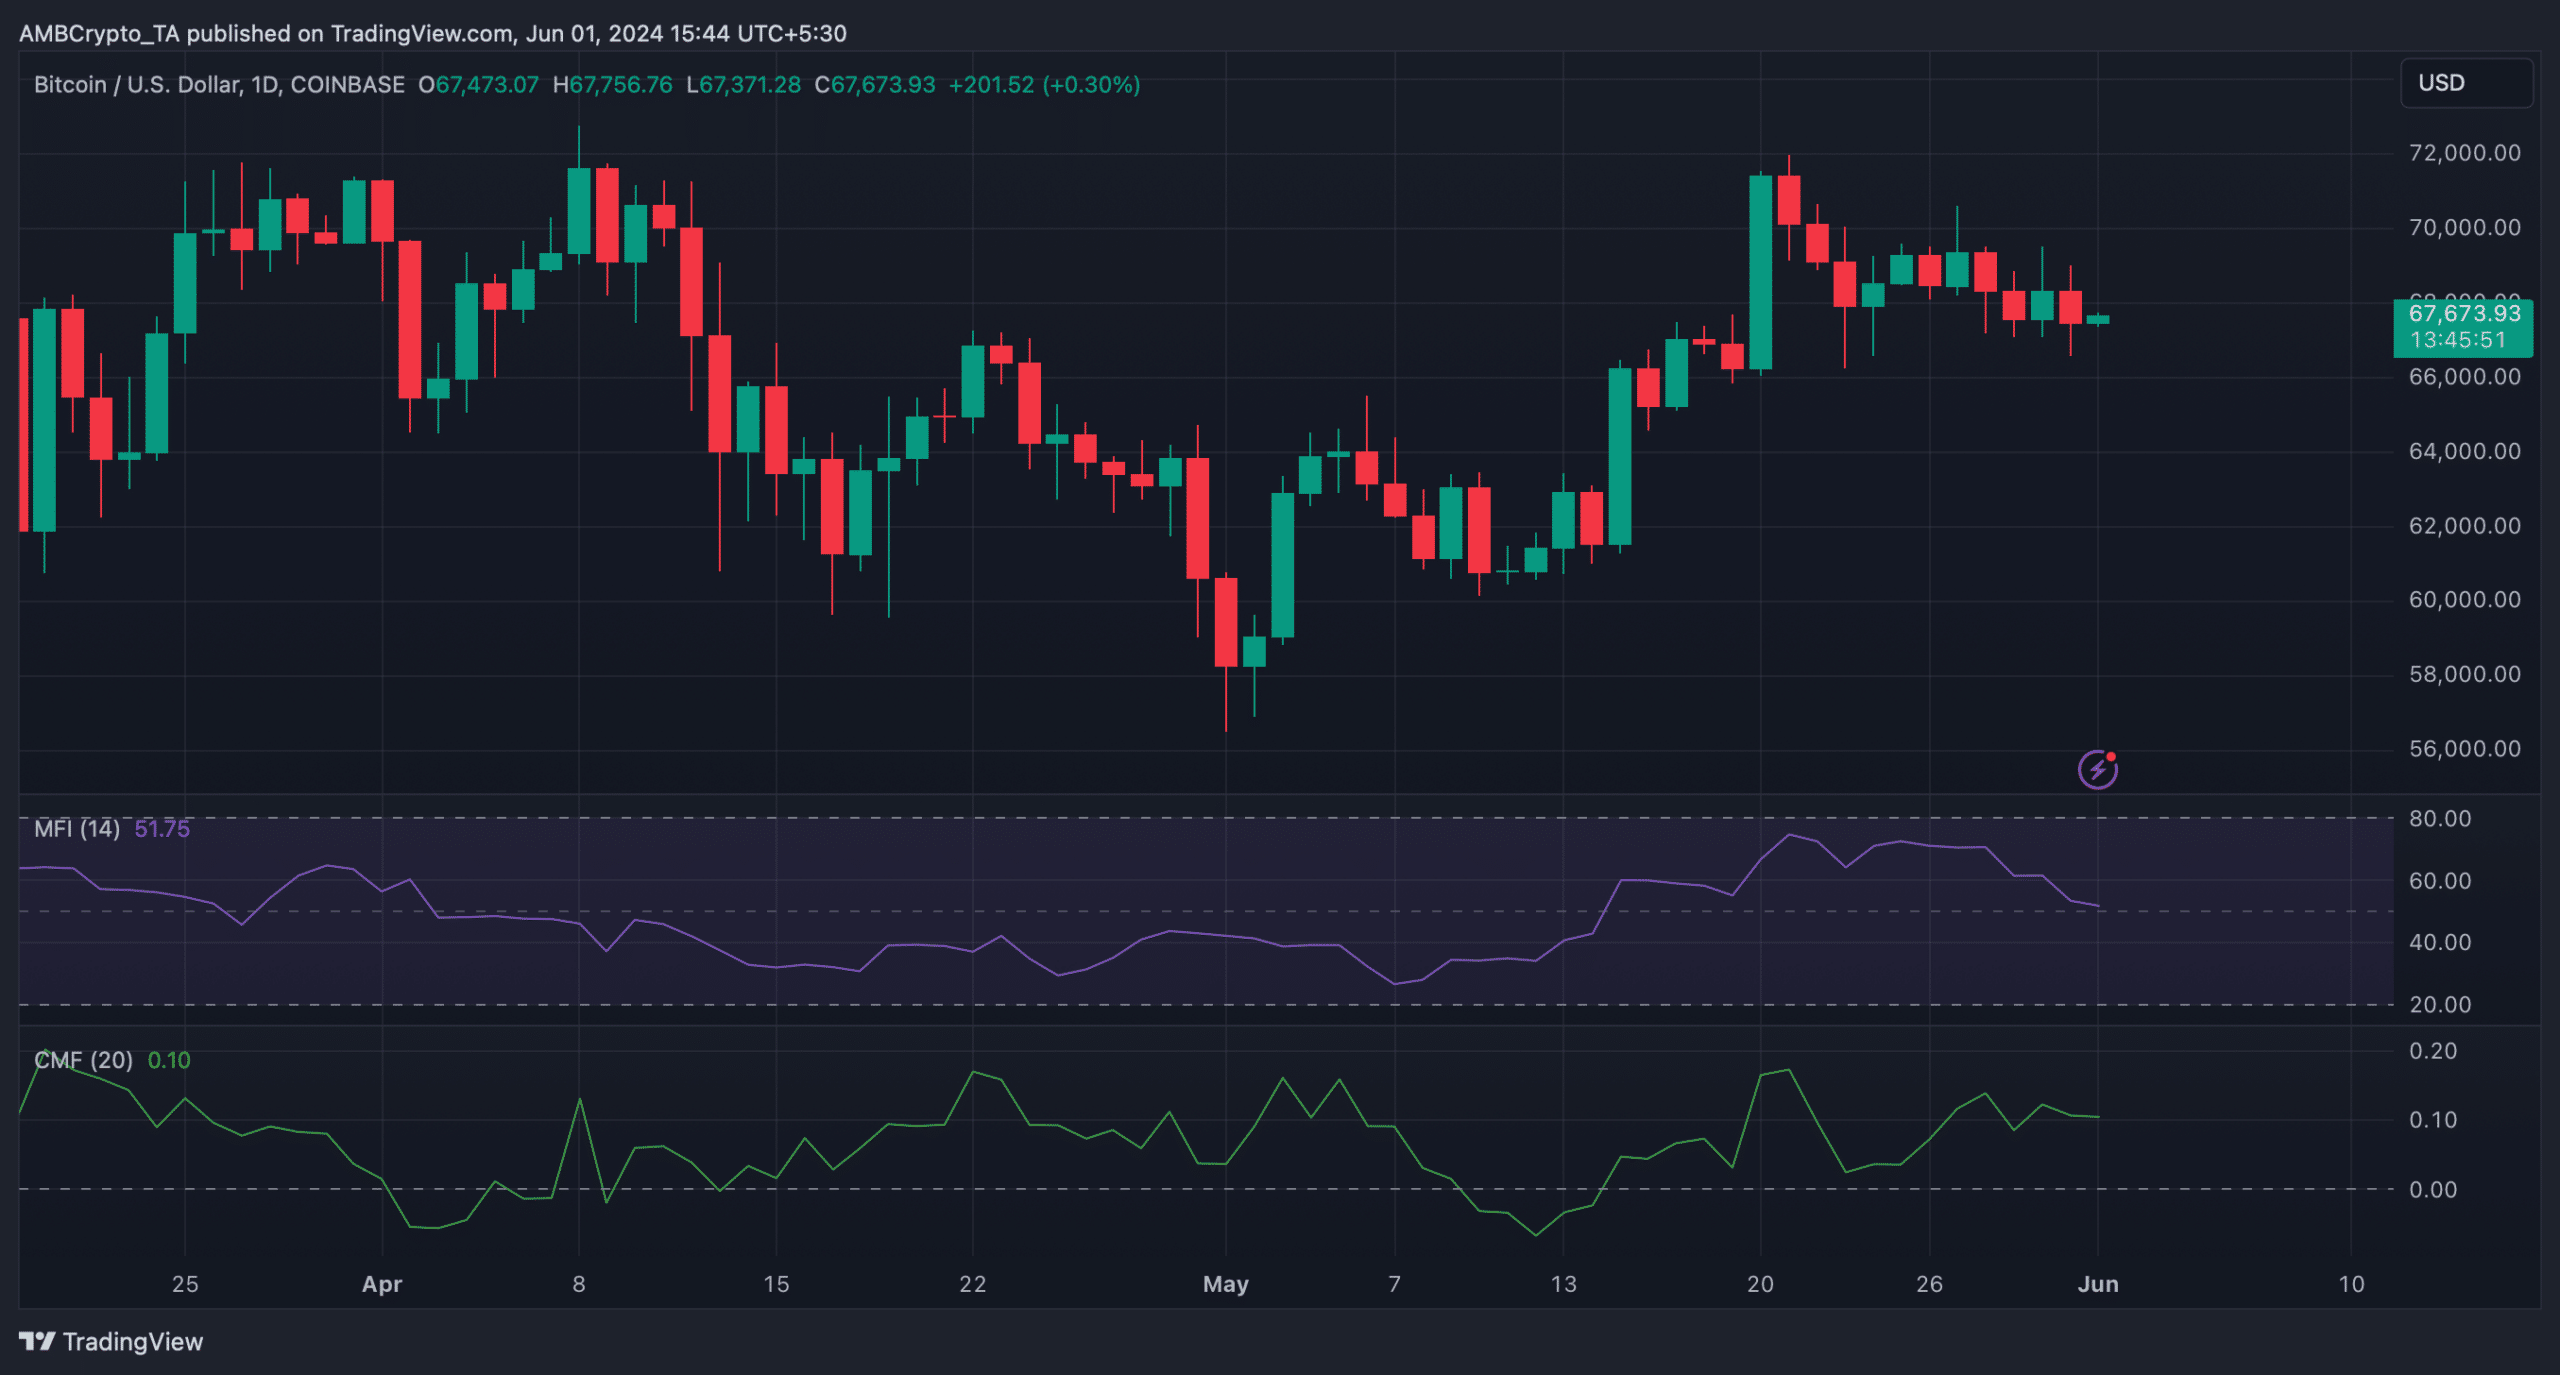
Source: TradingView


