Is Bitcoin’s failure to recover above $60,000 a sign of trouble

Thanks to Bitcoin’s invalidation at $60,000, a few investors have been sweating in their seats. Its correction down to $55,600 was expected to be met with immediate recovery. However, over the last 24 hours, it hasn’t managed to lock in a position above $60,000.
In this article, we will be looking at BTC’s market position from a wider, on-chain fundamental and market structure perspective. It will also analyze if it is actually necessary to lose sleep over BTC’s movement.
Bitcoin Long-Term Holders are not sweating
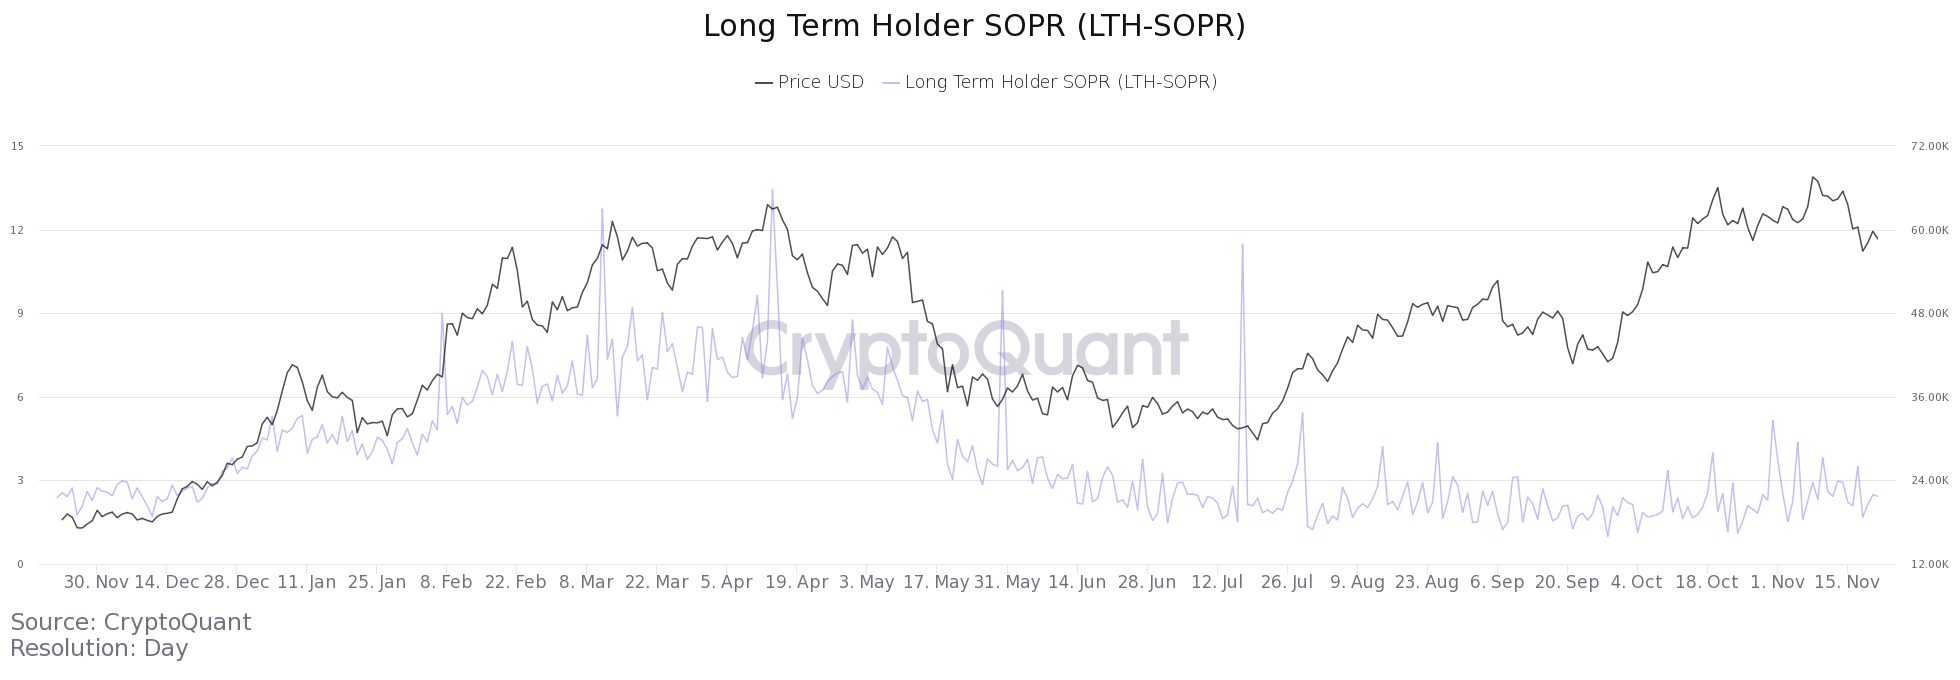
According to the attached chart, Bitcoin’s Long-Term holders have hardly broken a sweat over its recent corrections. In fact, data from Cryptoquant revealed little to no deflection in the LTH-SOPR’s value. What this implied was that BTC UTXOs with an alive time of more than 155 days haven’t changed addresses in the past 5 months.
Now, these are addresses holding a larger amount of BTC. Hence, a lack of selling pressure at their end is indicative of minimal investors’ fear.
In comparison, it can be observed that the value was extremely high during Q1 and Q2 of 2021. At the time, massive corrections of 50% were identified for the digital asset.
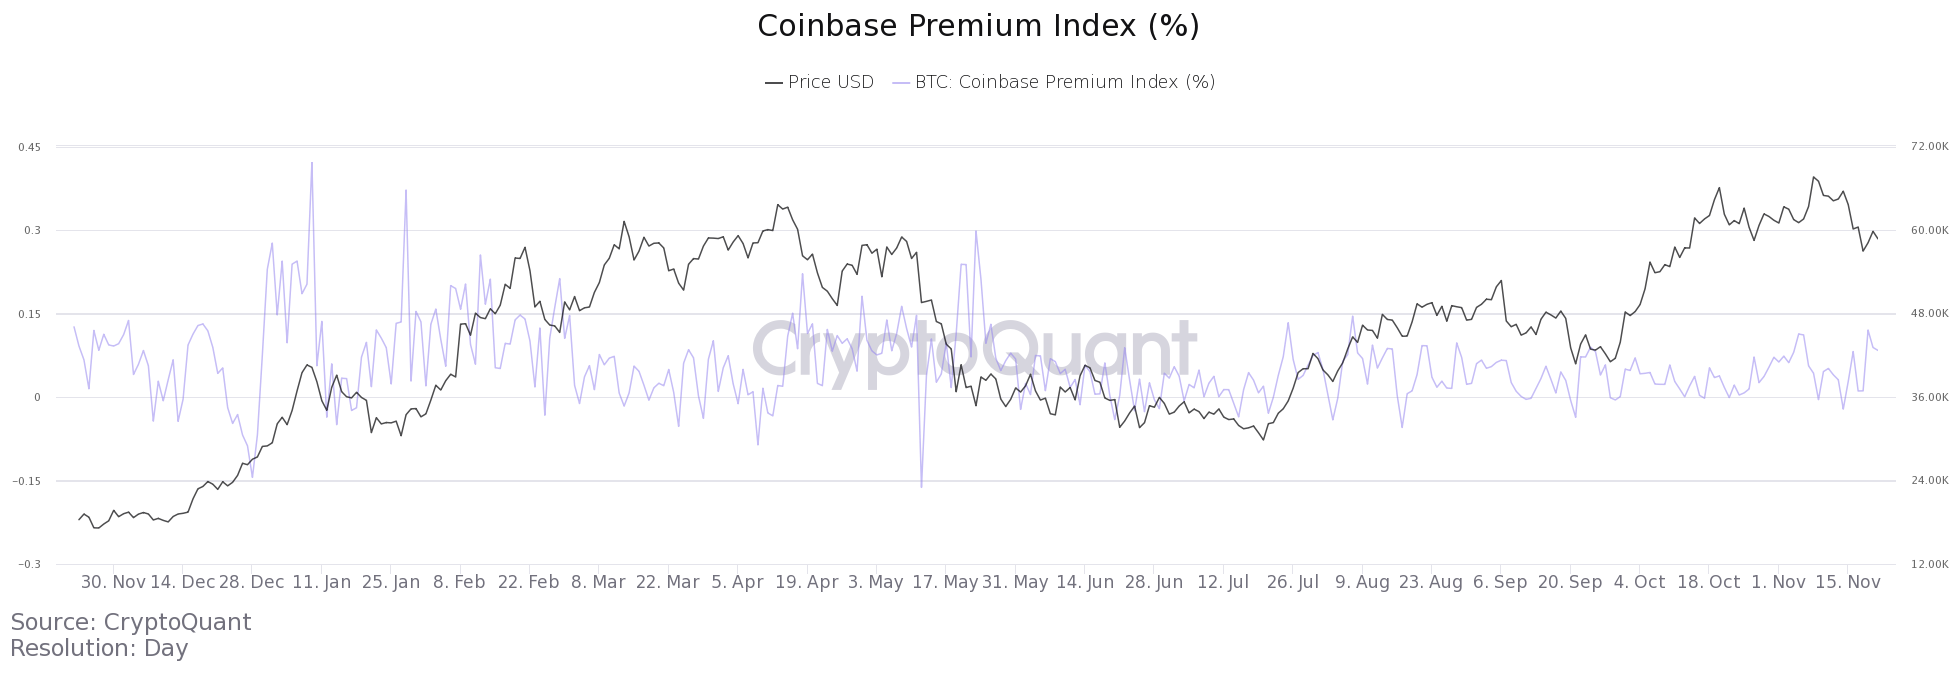
Similarly, the Coinbase premium index continued to maintain a steady hike on the charts. The premium index is defined as the percentage difference from BTC/USDT to Coinbase price of BTC/USD. Whenever the value is higher, it is a sign of stronger spot buying pressure from Coinbase traders.
The fact that the premium index did not illustrate a notable drop over the last week means that selling pressure isn’t mounting on the exchange either.
Is it just a typical correction?
From a point of technical structure, the correction looks more reasonable than devastating. Since its bullish recovery in July, Bitcoin has adopted a steady approach in terms of testing a strong resistance range. Its initial surge of $53,000 was met with a correction down to $42,000, after which it recorded a new all-time high.
Now, at press time, it can be deduced that the bullish structure will not break unless the price drops below or closes a daily candle under $53,000. The asset continuing to maintain a position above its inclined support is a strong long-term bullish sign.
Patience is key
Taking a hasty decision to sell right now might not be the best investment move. Bitcoin continues to remain in the green, as far as price structure and on-chain fundamentals are concerned.
Hence, it is perhaps best for investors to enjoy the ride for now.


