Long-term realized cap revealed a cooling trend and could signal breakout or deeper correction ahead
Weak momentum and volume suggested downside risk still persists
Bitcoin’s [BTC] price trajectory has been approaching another key inflection point lately. And, one critical on-chain metric could shape what happens next.
The long-term realized cap, a structural indicator of market strength, is nearing a decisive threshold. Historically, this level has determined whether Bitcoin sustains bullish momentum or enters a prolonged correction. Analysts are closely watching this zone, as holding it could reinforce confidence in the current cycle, while a breakdown may signal a broader shift in market dynamics.
What is the long-term realized market cap?
This metric isolates the cost basis of older UTXOs (unspent transaction outputs), offering insights into the behavior of long-term holders. These investors typically accumulate during bear markets and distribute in bull phases.
A rising long-term realized cap suggests sustains capital inflows and growing conviction, while a decline may point to profit-taking or weakening market sentiment.
Historically, Bitcoin has reacted sharply whenever this metric has approached key levels – Either launching new rallies or falling into consolidation.
What does the data say?
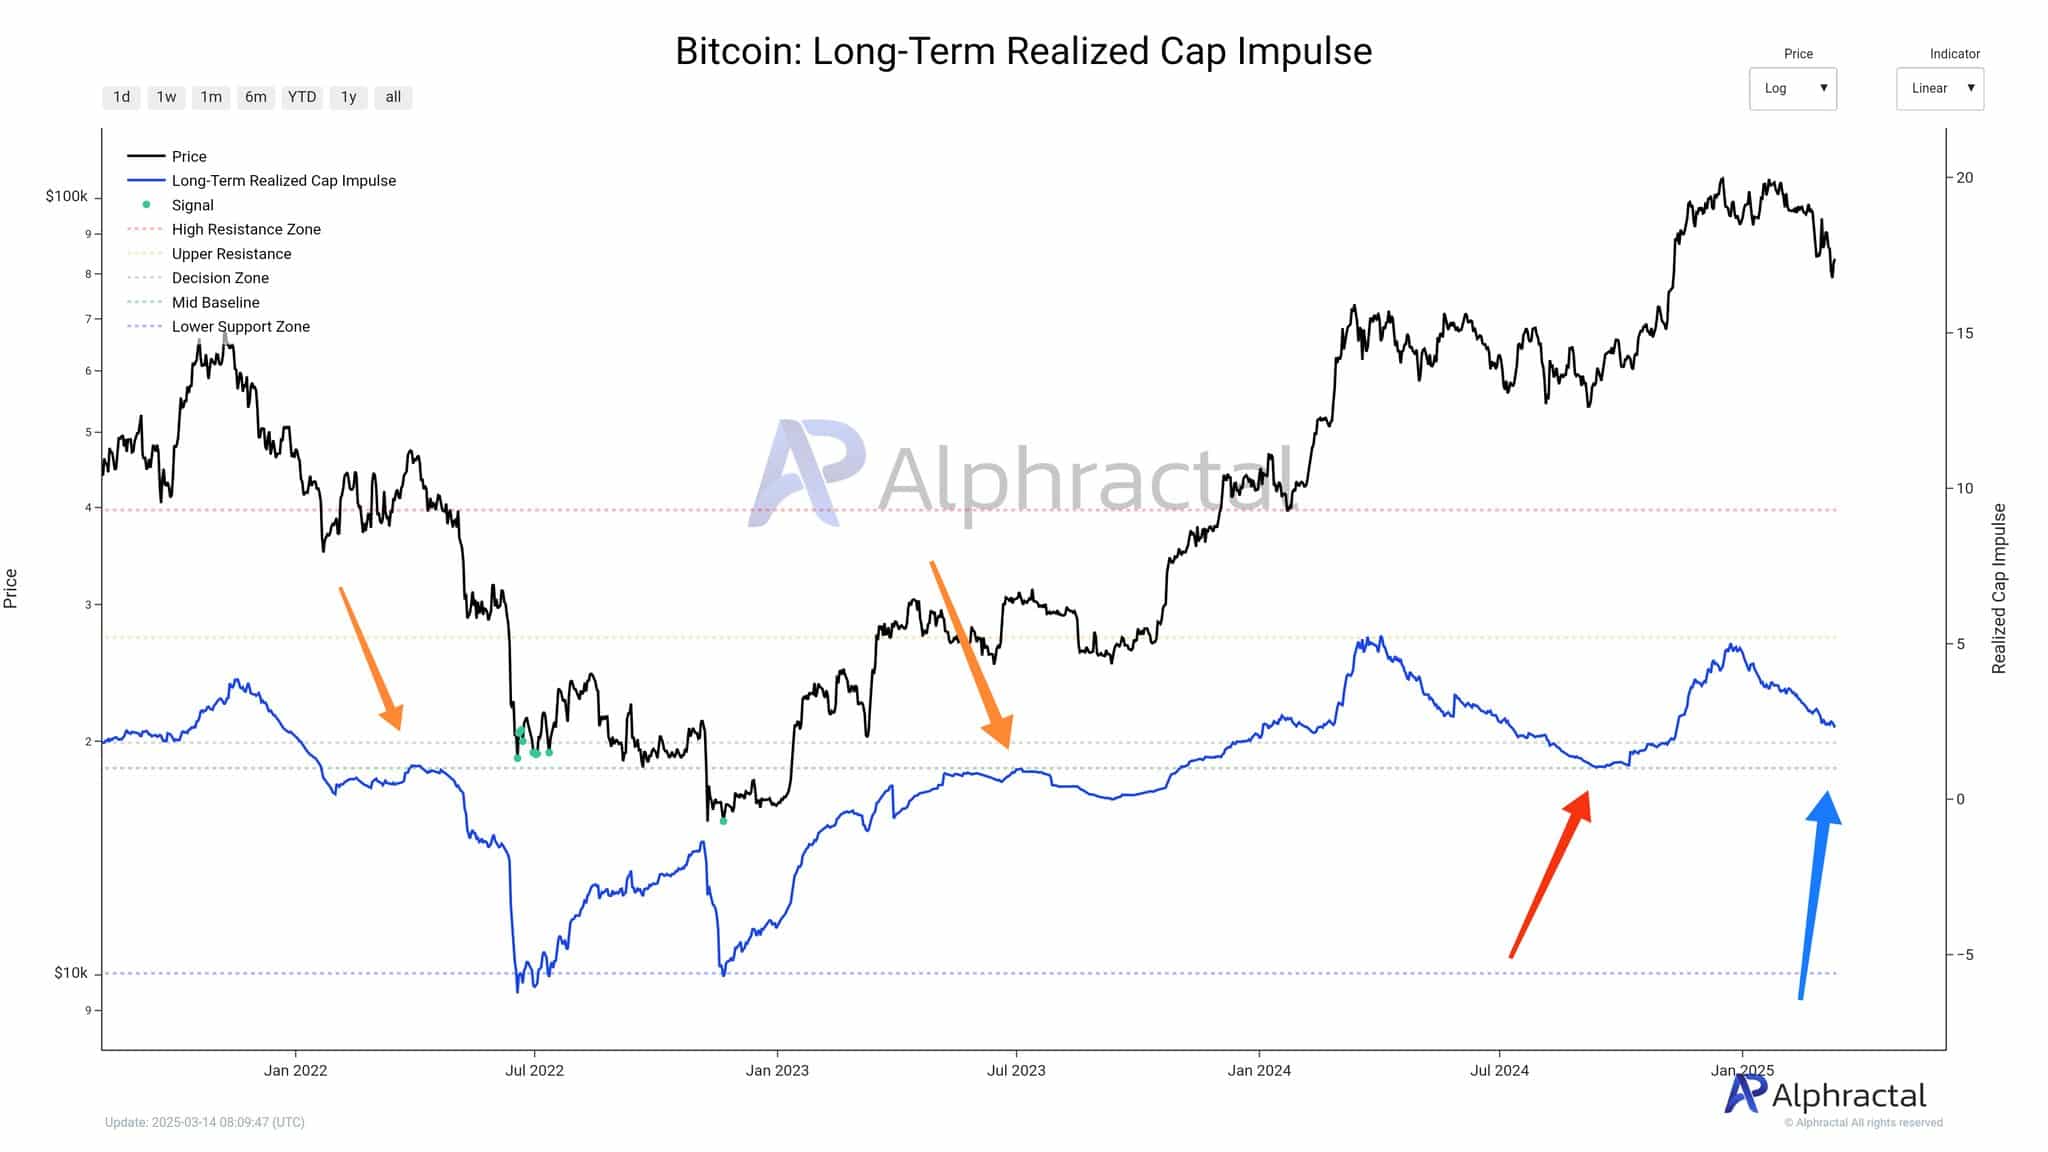
Source: Alphractal
Latest data revealed a decline from local highs, with the metric drifting towards the mid-baseline. This cooling trend could indicate that the market may be entering a pause after months of bullish momentum.
Historically, a neutral or negative realized cap impulse has preceded consolidation phases – or, in some cases, market corrections. In the attached chart, the latest red arrow pointed to this risk, though a blue arrow hinted at the potential for a recovery.
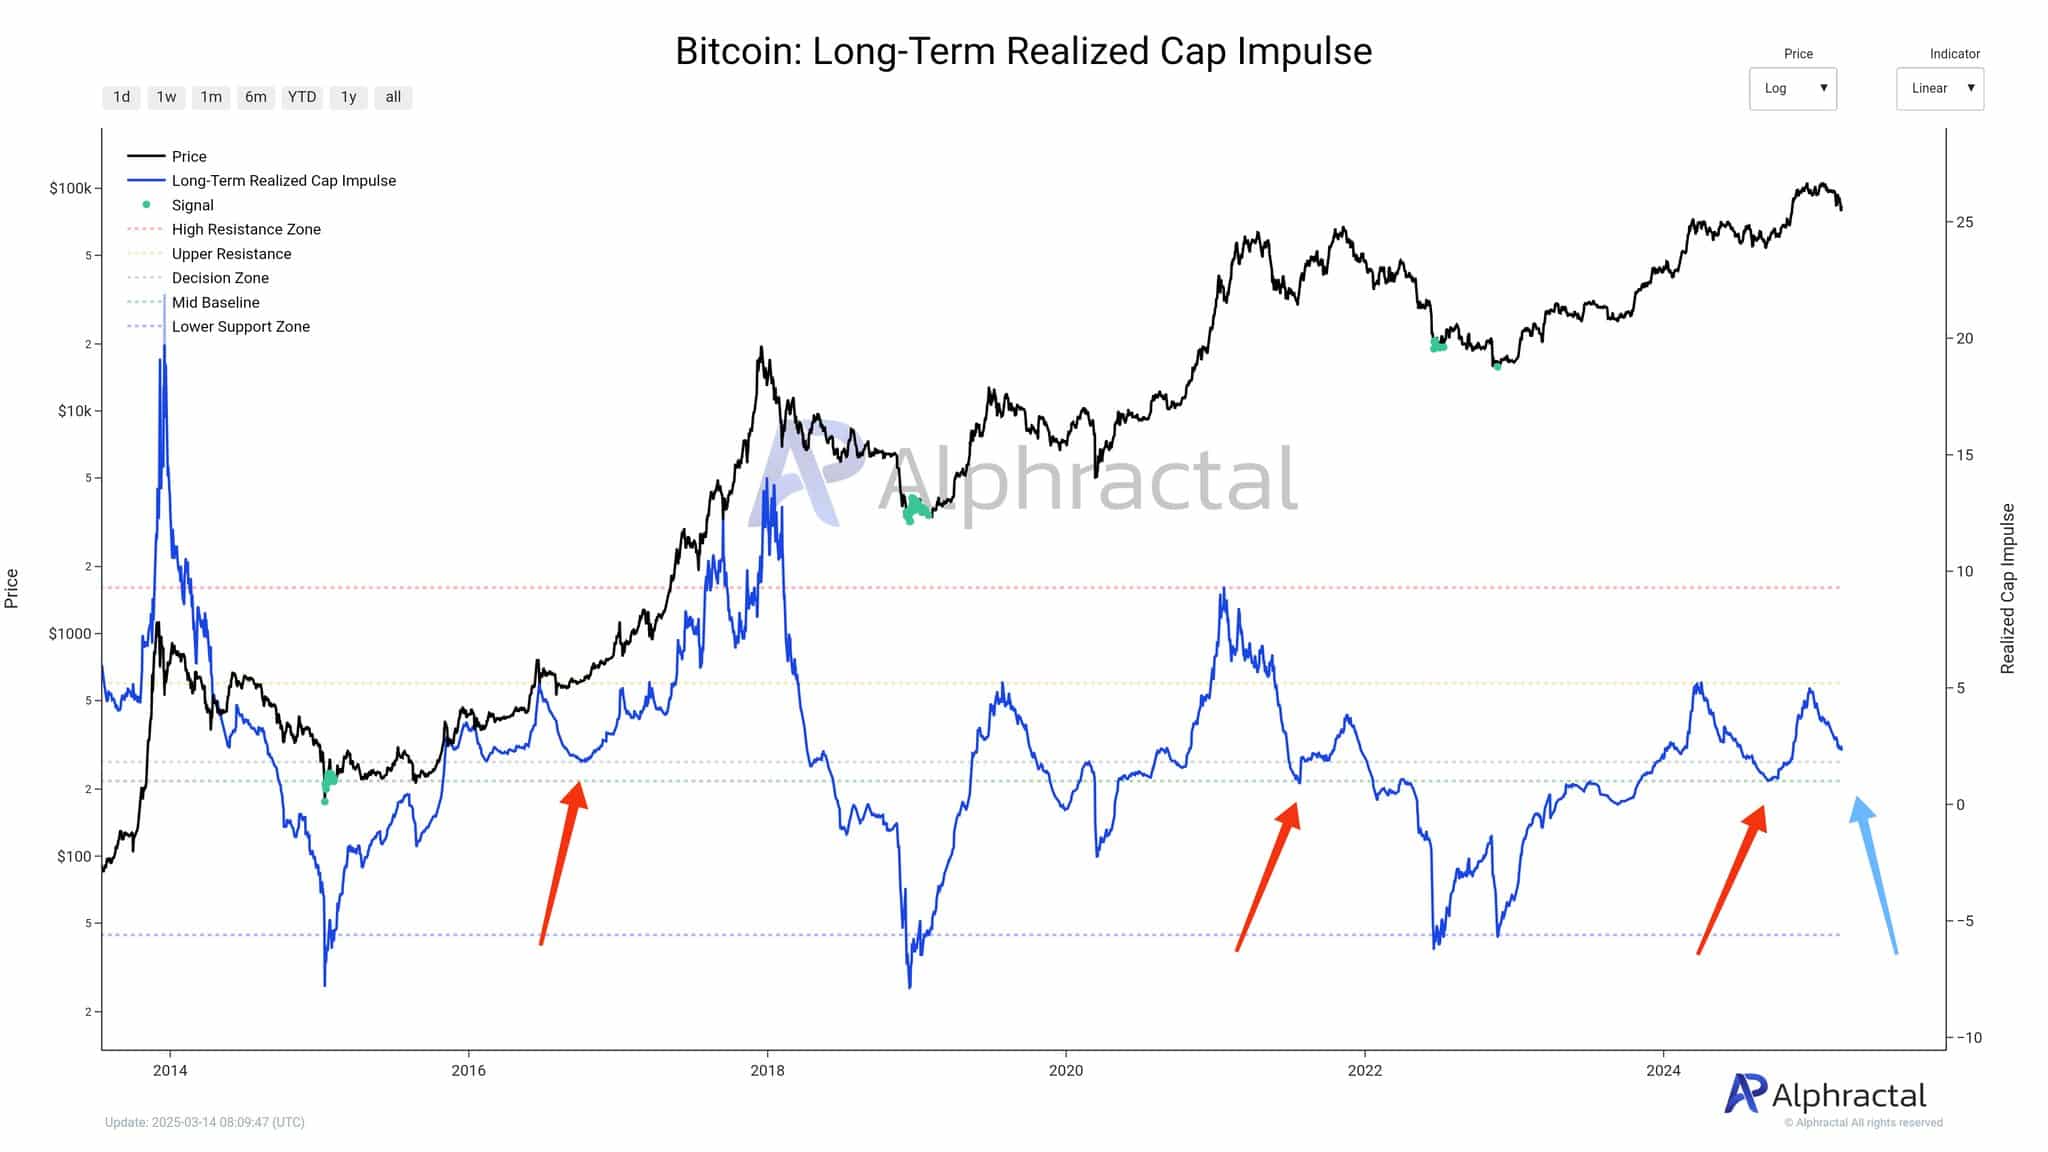
Source: Alphractal
Notably, in both 2016 and 2020, dips in this metric were followed by renewed bullish momentum and eventual all-time highs. If this pattern holds, Bitcoin could soon shift into an accumulation phase ahead of another breakout.
Still, while on-chain signals remain cautiously optimistic, macro and market-specific factors will heavily influence the road ahead.
Bitcoin’s price outlook
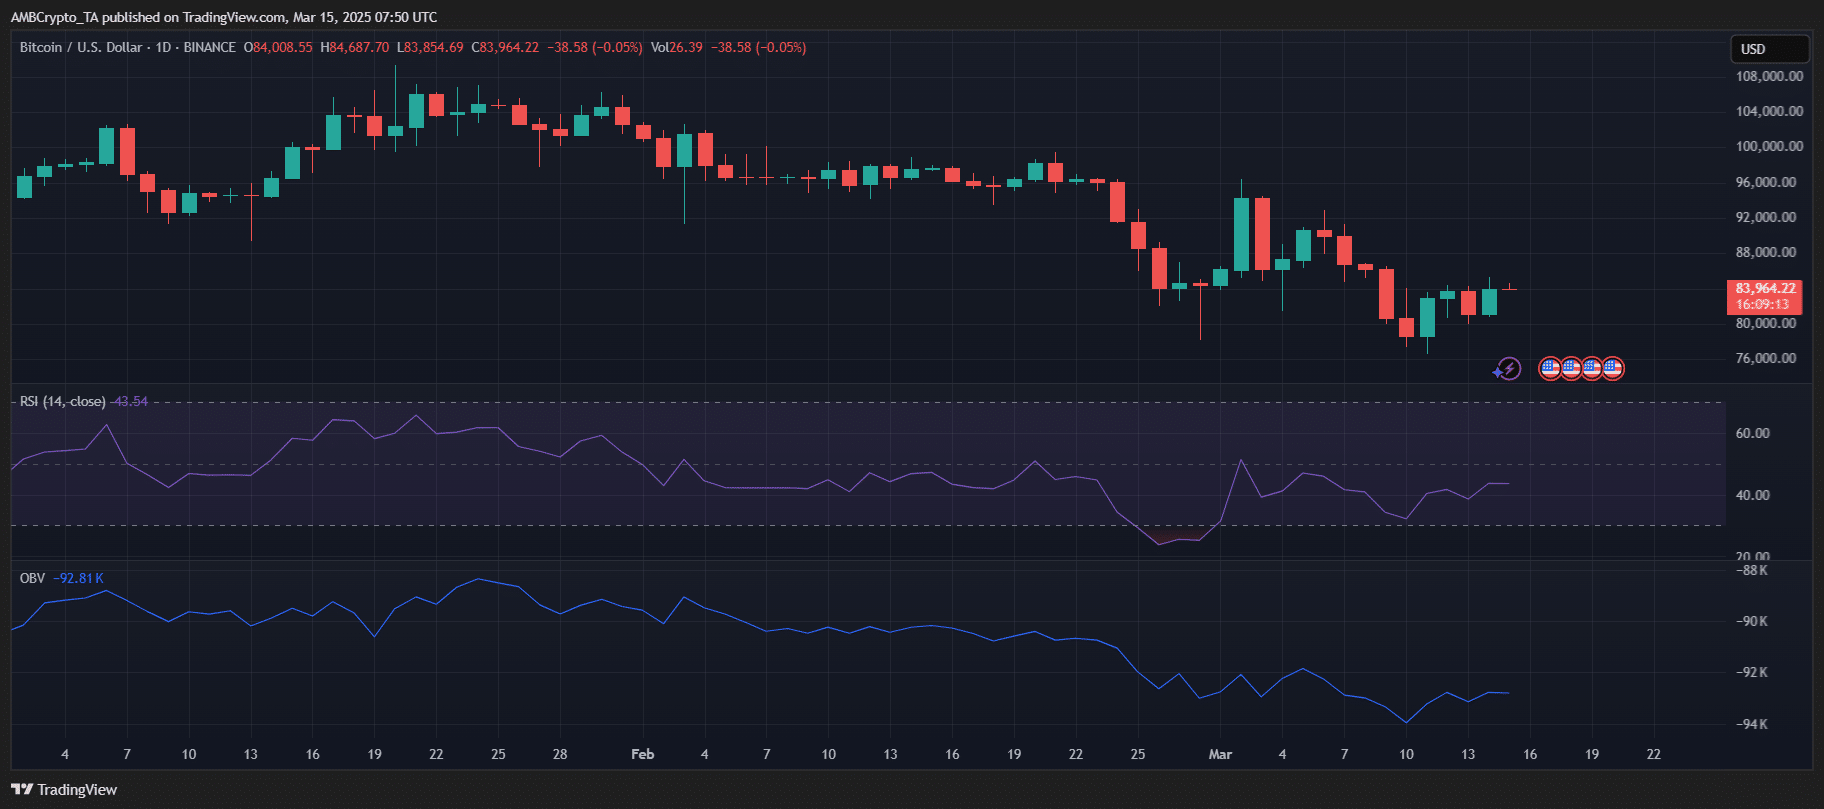
Source: TradingView
Bitcoin was trading at $83,964 at press time, following a minor decline of 0.05%. The RSI sat at 43.54, below the neutral 50 level – Suggesting sellers still hold the upper hand. OBV also continued its downtrend, reflecting fading buy-side pressure.
The broader price structure has been bearish too, with a consistent pattern of lower highs and lower lows since February. A decisive break above $88,000 is needed to reverse this trend. Conversely, a drop below $82,000 could open the door to further downside.
Until buyers regain control, Bitcoin might be likely to remain range-bound. Or worse, trend lower in the short term.
Samantha is a full-time crypto journalist with 2 years of writing experience in the field. Her key area of interest is the political ramifications of crypto-centric laws around the world. An avid market trader, Samantha also has a keen eye for price anomalies on trading charts.


![Sei [SEI]](https://ambcrypto.com/wp-content/uploads/2025/06/Erastus-2025-06-29T145427.668-1-400x240.png)
