Is Bitcoin’s road to $75k harder than we thought?
Since March 2023, the STH realized cap spikes above $6 billion saw a correction commence over the next few weeks.

- Short-term holder activity suggested Bitcoin might have formed a local top nearly three weeks ago.
- Long-term holder metrics from Santiment flashed warning signals.
Bitcoin [BTC] saw a rapid rise in the short-term holder (STH) realized cap metric.
Realized capitalization is a variation of market capitalization that is calculated based on the price the coin was last moved at, instead of the current market price.
The recent uptick in the realized cap could mean a local top was in.
Does that mean we see a retracement to the $66k region in the next few days, or will the price target the liquidity cluster overhead before a correction?
Bitcoin short-term holders take profits
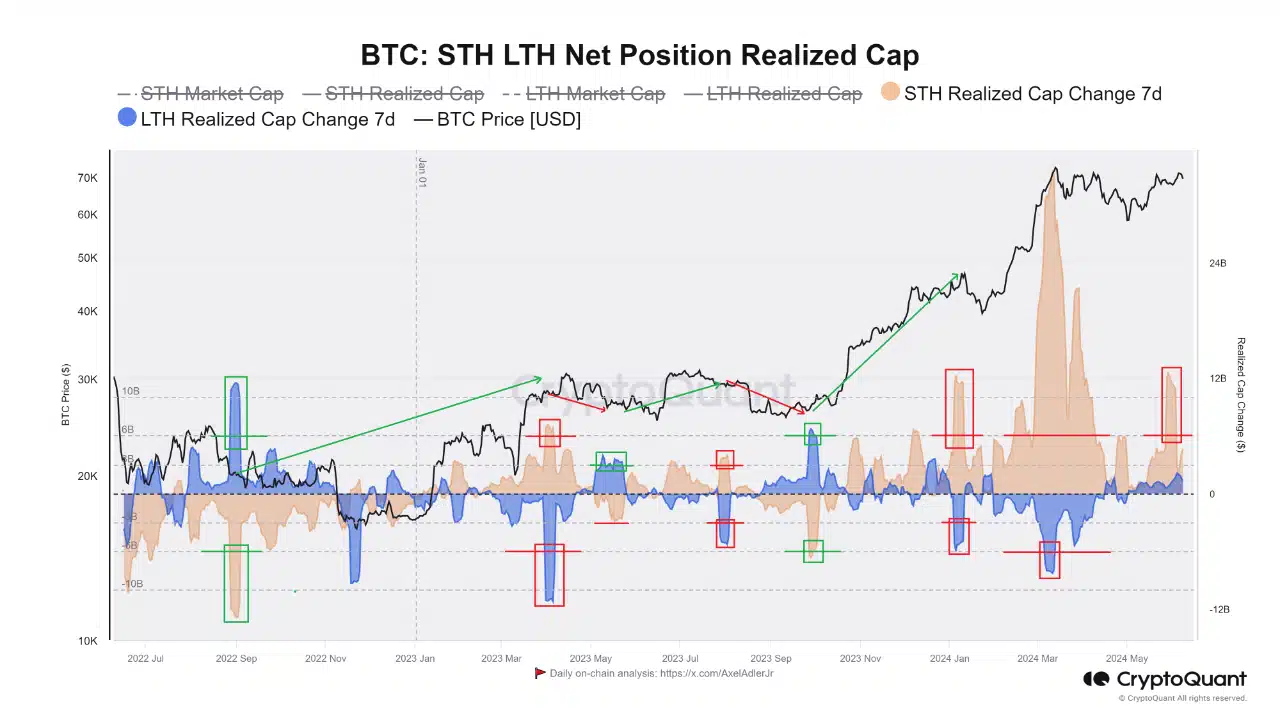
In a post on CryptoQuant Insights, analyst Amr Taha noted that the STH realized market cap change saw a dramatic spike above $10 billion.
He noted that STH realized cap increases of over $6 billion generally accompany holders realizing a small profit and buyers entering during market tops.
It does not guarantee an immediate dip, but since March 2023, the STH realized cap spikes above $6 billion saw a correction commence over the next few weeks.
The metric tracks the realized cap change for both long-term holders (LTH) and STH. In March 2024, the LTH 7-day realized cap metric fell below $6 billion.
This generally indicates profit-taking activity from LTH and could mark local tops.
Bitcoin was yet to push above the all-time high set in March at $73.7k. The STH activity might stall the bulls’ plans.
Warning signs of network stagnancy
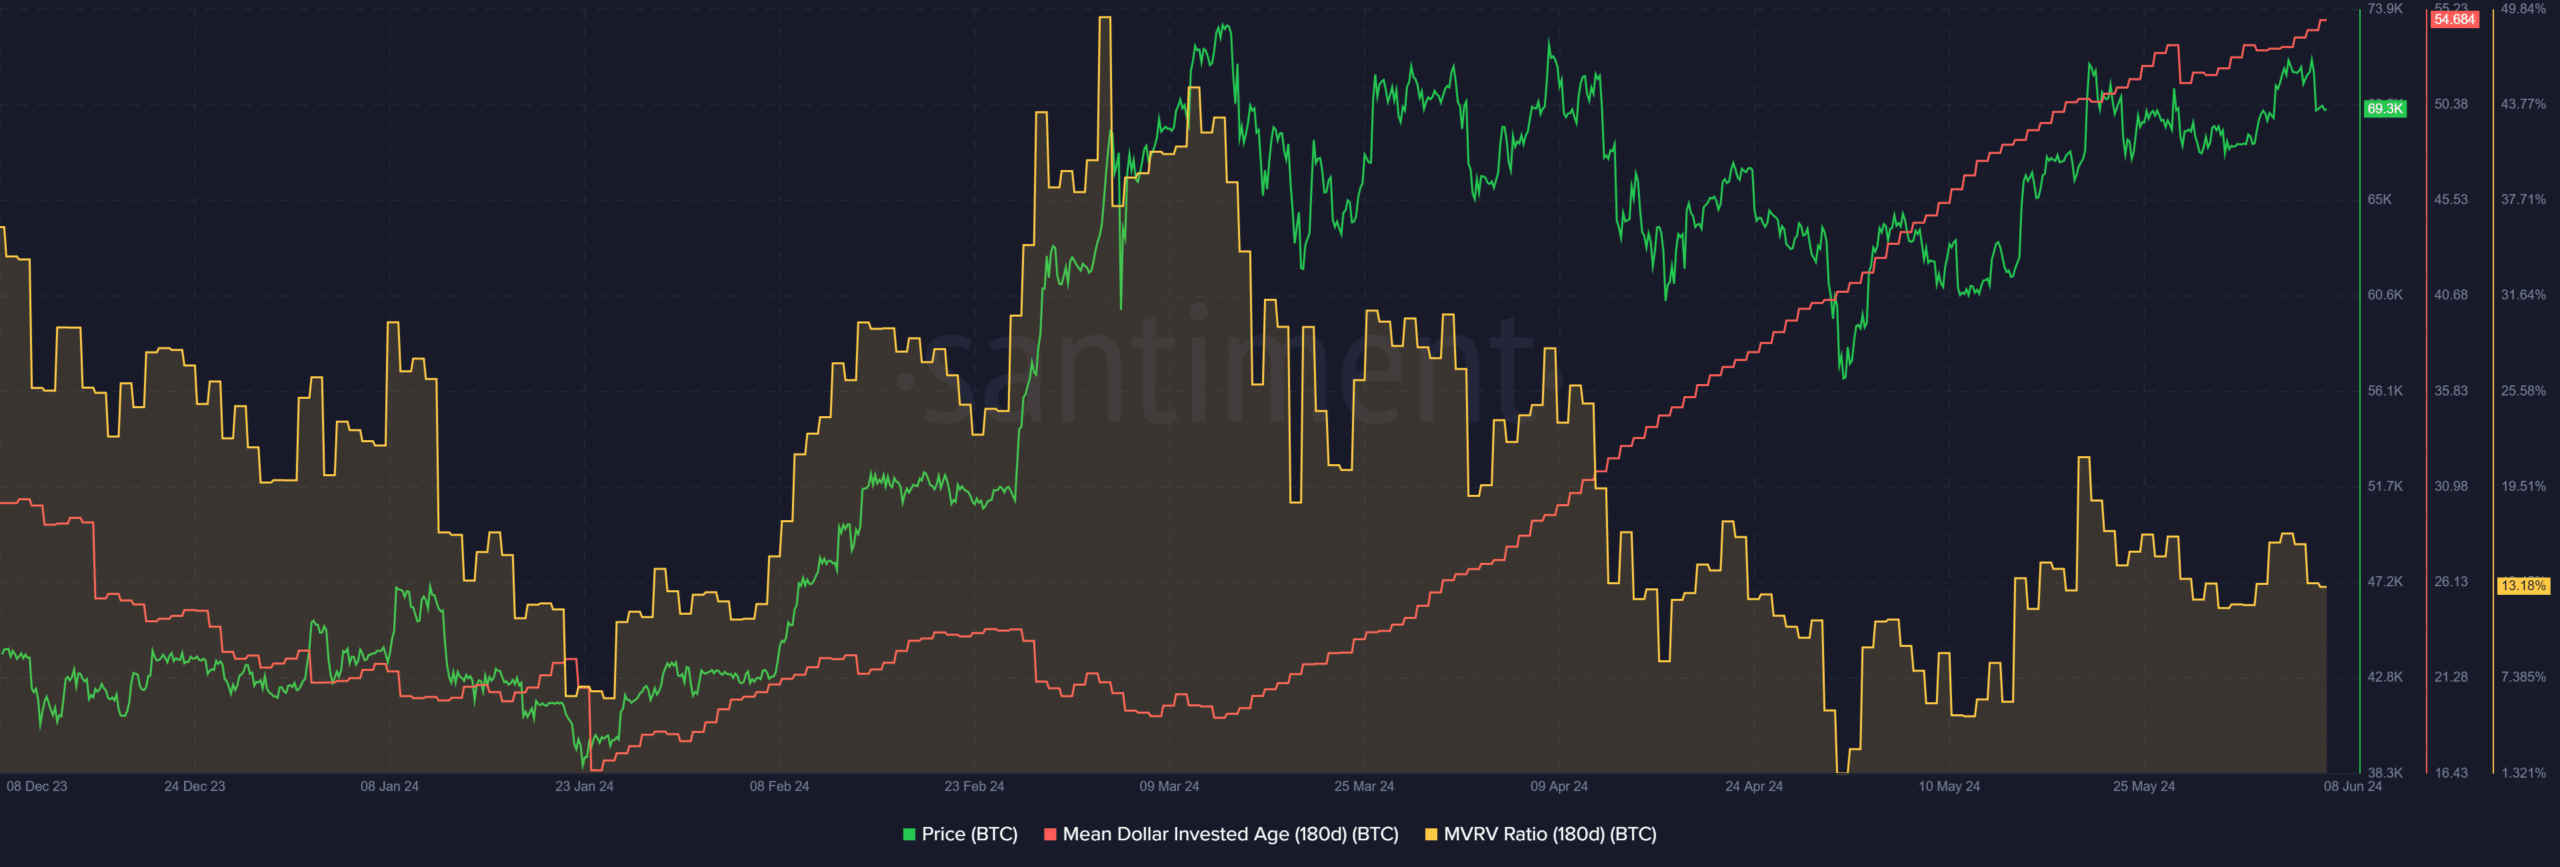
The mean dollar invested age (MDIA) has been trending upward since mid-March. The MDIA calculates the average age of the tokens on the network weighted by their purchase price. An uptrend is a bullish sign.
When it ascends for a drawn-out time period, it could be a sign of network stagnancy, due to fewer transactions. The dormant tokens might also be an early sign of a lack of a new influx of investors.
The MVRV ratio showed holders were at a healthy profit, but fears of imminent profit-taking due to this metric need not be high.
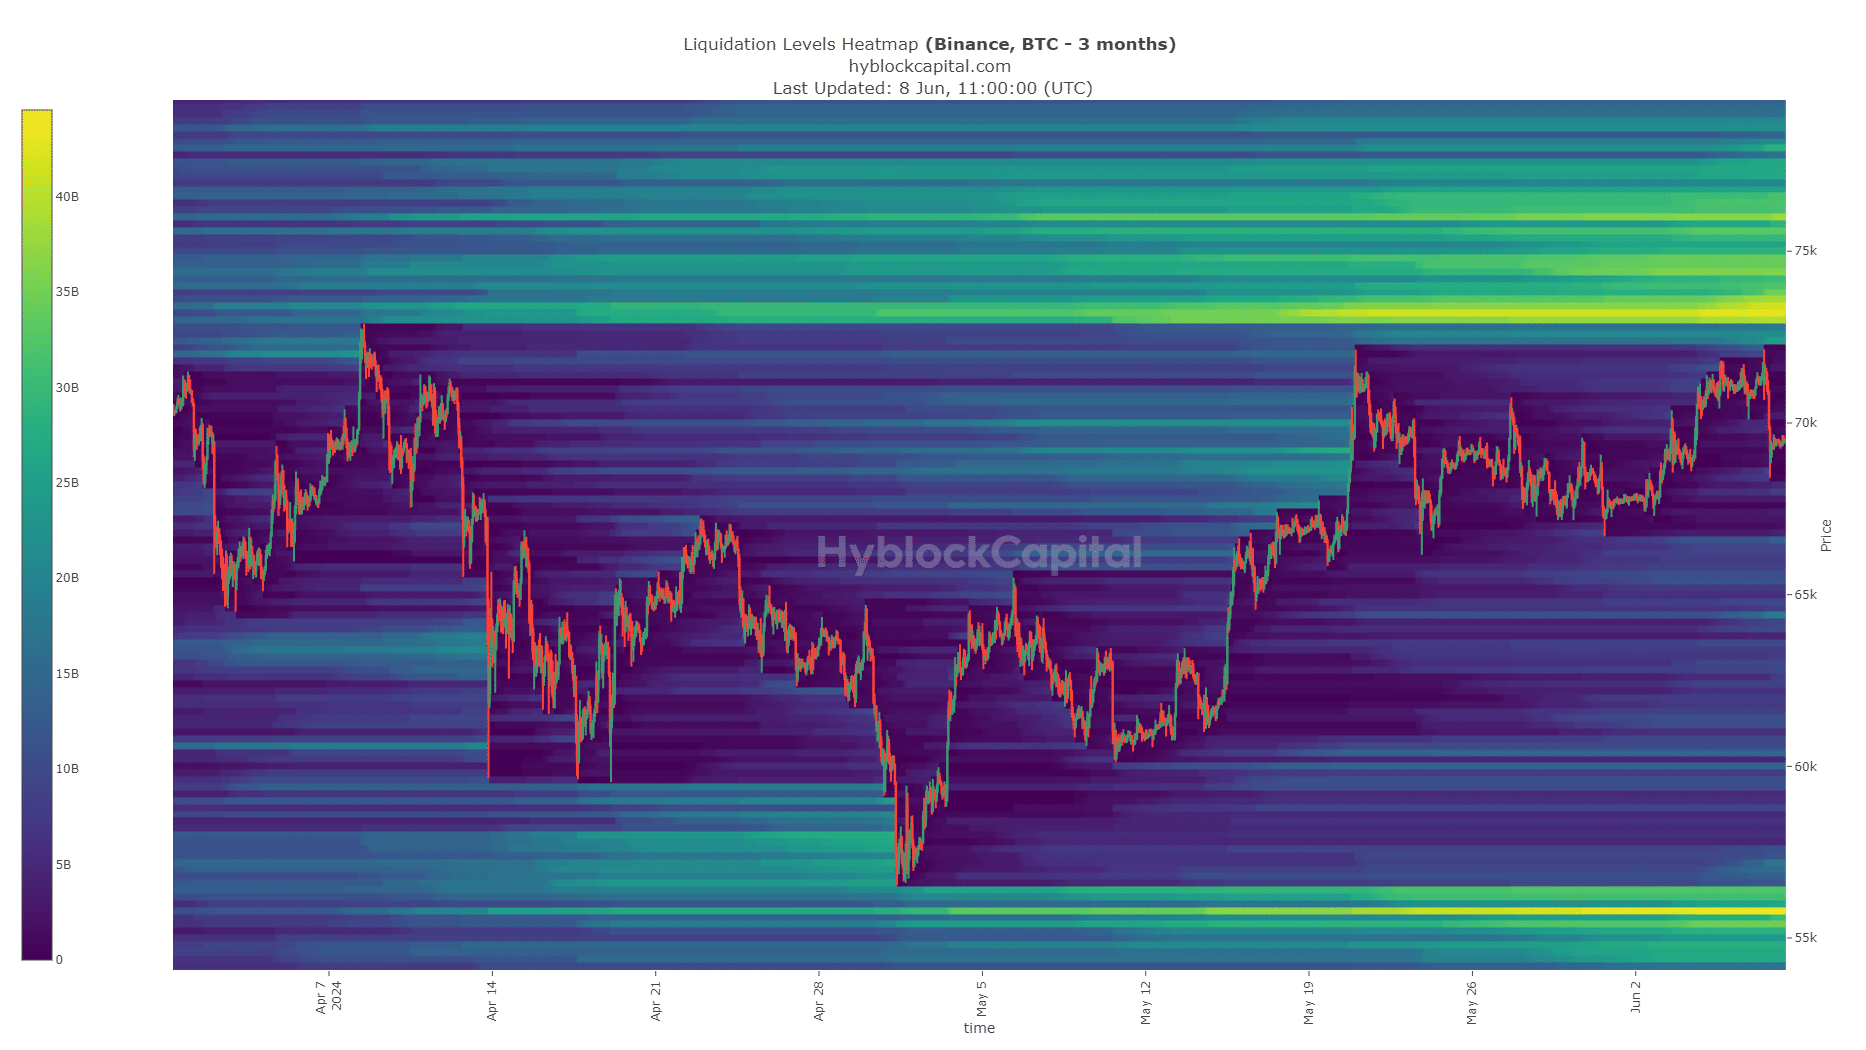
The liquidation heatmap showed a relative sparsity of liquidation levels below current market prices. Conversely, the $73k-$75k region was full of short liquidations.
Read Bitcoin’s [BTC] Price Prediction 2024-25
This pool of liquidity might be swept before the next downward move.
It’s been nearly two months after the halving, and Bitcoin’s trend remains unclear. Historically, the Q3 performance of BTC has been relatively weak. Investors need to be prepared for a long, drawn-out battle.


