Is BNB set for a slide below $500? Key indicators point to market shift

- BNB may retest support below $500.
- Its futures open interest has fallen by over 20% in the past two weeks.
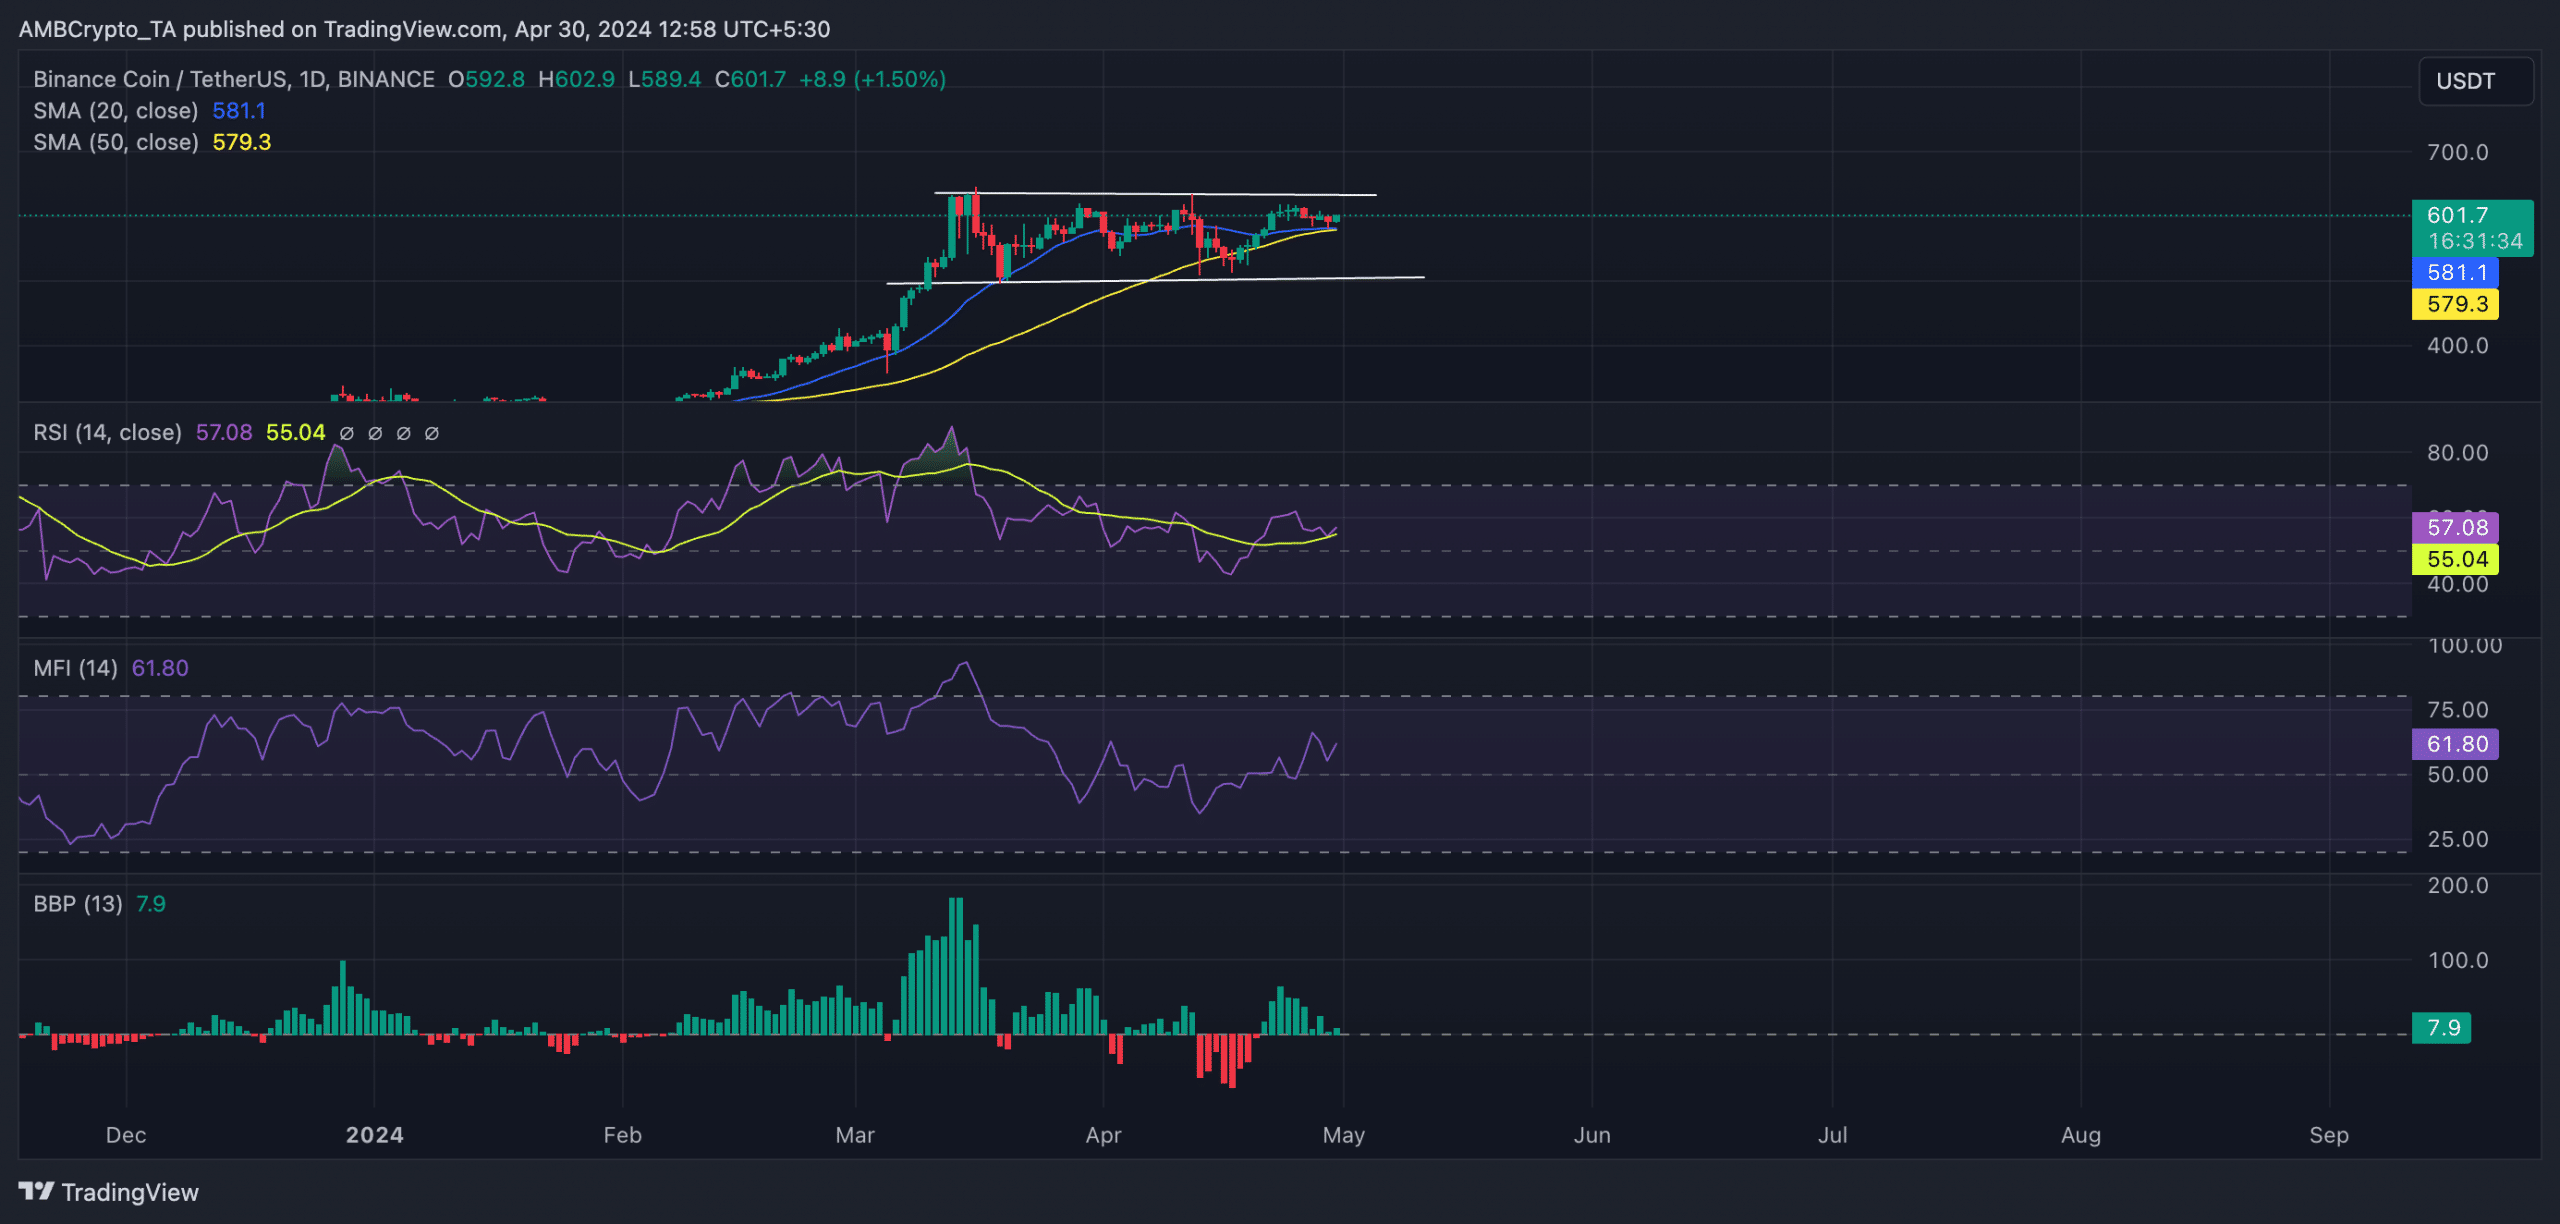
Binance Coin [BNB] may decline below the $500 price mark as its price attempts to fall below its moving averages. AMBCrypto’s readings of BNB’s 1-day price chart showed the coin’s price inching closer to its 20-day and 50-day moving averages (MAs).
What to expect?
These short-term averages are often used to identify trends. If an asset’s price falls below its 20-day and 50-day MAs, it signals a shift in momentum from bullish to bearish. When accompanied by a decline in buying pressure, it confirms that the market is in a downtrend.
If bearish sentiment spikes and BNB falls below these MAs, the coin’s price could descend to exchange hands at the strong support price level of $495.
If BNB’s buying volume declines, the possibility of this happening is further strengthened. However, an assessment of the coin’s key momentum indicators showed that this may not be true for the altcoin.
Readings from its Relative Strength Indicator (RSI) and Money Flow Index (MFI) showed their values resting above their respective neutral lines. As of this writing, BNB’s RSI was 57.05, while its MFI was 61.78.
The values of these indicators showed buying activity slightly outpaced coin sell-offs among market participants.
Further, despite BNB’s price consolidation in the last week, its Elder-Ray Index continued to return positive values.
The indicator measures the relationship between the strength of the altcoin’s buyers and sellers in the market. When it is positive, it means that bull power is dominant in the market.
At the time of press, BNB’s Elder-Ray Index was 0.29. The indicator has returned only positive values since the 21st of April.
Realistic or not, here’s BNB’s market cap in SOL’s terms
BNB in the derivatives market
An assessment of the BNB futures market revealed a decline in its open interest since 11th April. At $592 million at press time, the coin’s futures open interest has since fallen by 23%, according to Coinglass’ data.
An asset’s futures open interest refers to the total number of the coin’s futures contracts that have yet to be settled or closed. When it declines in this manner, it indicates an increase in the number of market participants exiting their positions without opening new ones.


