Is BTC in early stages of a long-term bull rally? This historically accurate indicator suggests…
Bitcoin's performance of 2023 has left the market and BTC enthusiasts on a winning spree. However, as per additional information, BTC could only be commencing its bull rally of 2023 and there's more to come.

- Bitcoin’s reserve risk indicator suggests that the market is on its long-term bullish recovery trend.
- The bullish expectations align with Bitcoin’s pricing model.
Bitcoin’s bullish 2023 performance so far has attracted mixed reactions. There are two main factions: one consisting of die-hard bulls who believe that this rally is the start of the next major bull run and the doubters who expect at least one more major dip before the big rip.
Is your portfolio green? Check out the Bitcoin Profit Calculator
So, which faction is right? Well, the answer might be easier to find than expected thanks to on-chain historical data. Some on-chain indicators and metrics offer some level of accuracy regarding Bitcoin’s position. The Reserve Risk indicator (RRI) is perhaps one of the most overlooked among them.
Glassnode describes the RRI as a cyclical indicator that demonstrates an asset’s risk-reward ratio relative to investor conviction and confidence. It is an ideal indicator for a long-term outlook. So what makes this indicator so special?
The RRI’s historical accuracy in timing trends
The RRI has a neutral line on which it oscillates and crossings on this line carry a lot of significance. For example, Bitcoin pumped by 2,830% after crossing the 0 line in 2013, 566% in 2014, 6,400% in 2017, 99% in 2019, and 487% in 2021.
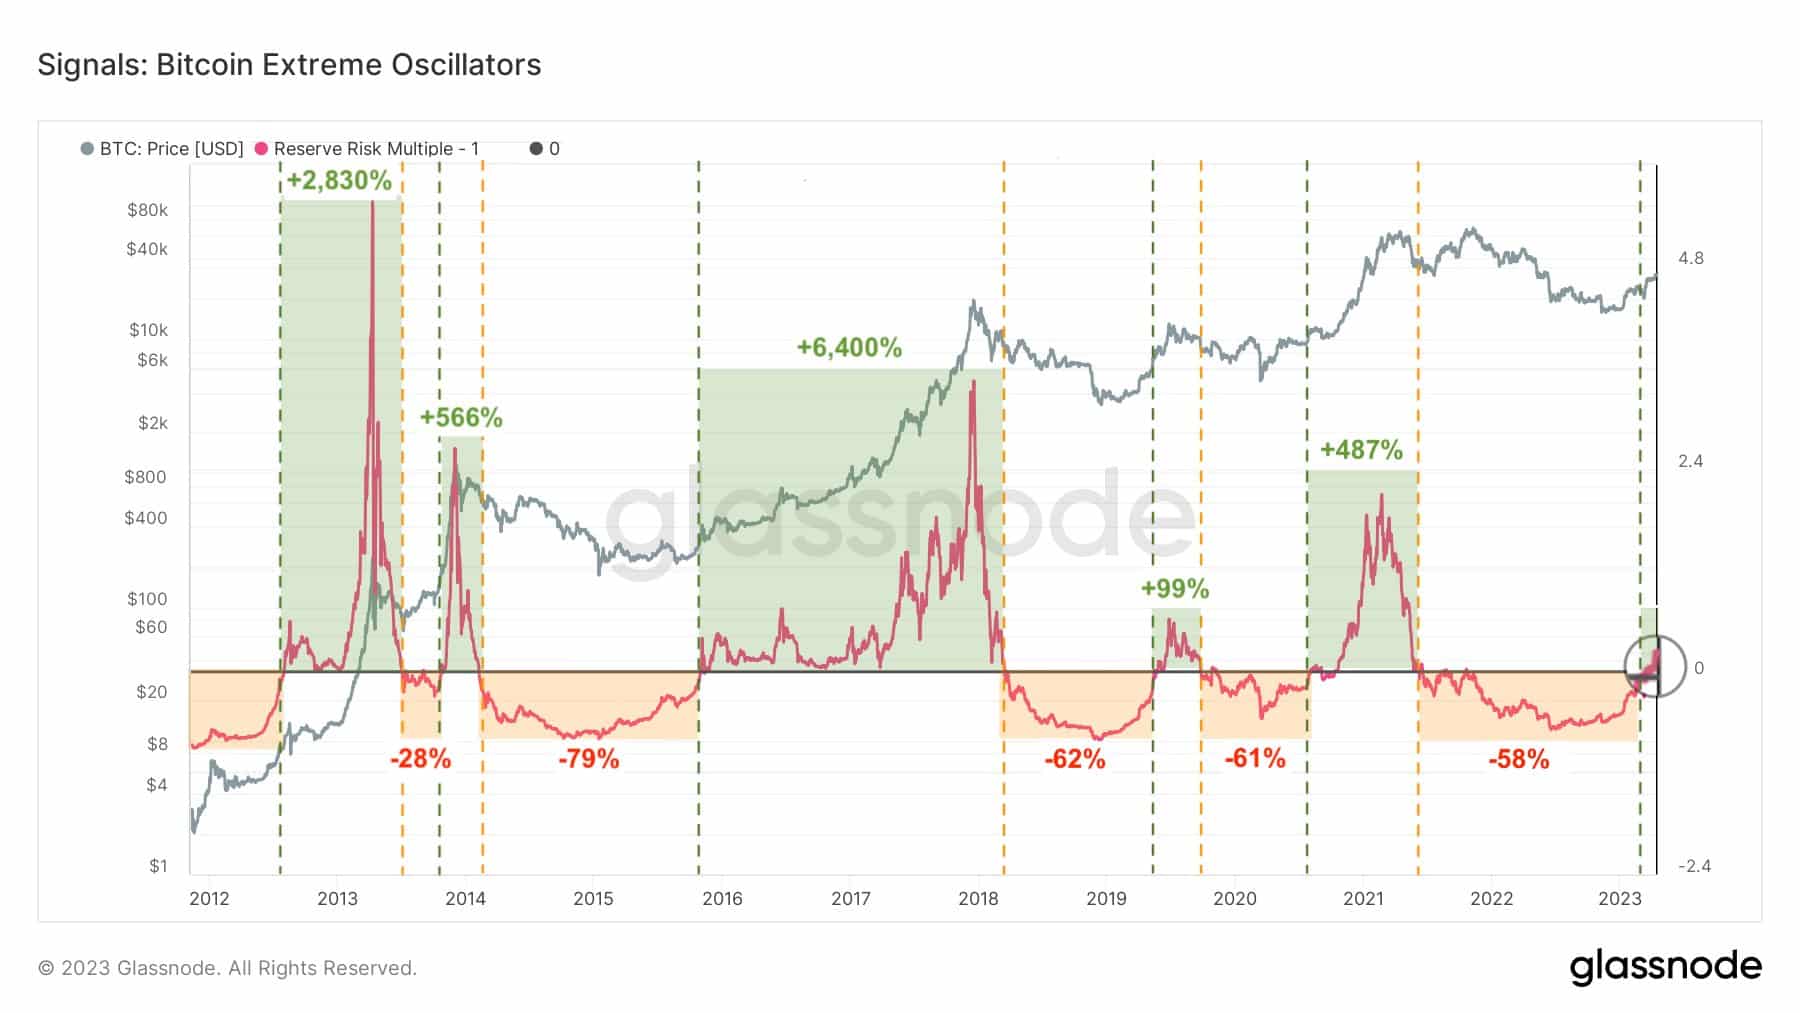
The opposite is also true where it registered significant sell pressure after crossing below the 0 line. Bitcoin dipped by 79% in 2015, 62% in 2019, 61% in 2020, and 58% in 2022. Note that these readings are after each crossing.
Given the historic performance, one can assume that each crossing confirmed a directional breakout or breakdown. This is noteworthy because Bitcoin’s 2023 rally recently pushed above the 0 line. This means BTC holders can expect a sizable rally in the next few months.
How big of a rally will 2023 offer?
BTC holders should note that a massive rally is not always guaranteed, especially in the short term. An ideal example would be the 2019 crossing which resulted in a 99% uptick, which for Bitcoin is a bit lacking. The 2016 crossing can be taken as another example where the mega pump came more than 12 months after crossing the 0 line.
How many are 1,10,100 BTCs worth today
The good thing is that we can verify the above data with other models. For example, Bitcoin’s pricing model has historically underscored a major rally after the price recovers back above the realized price level.
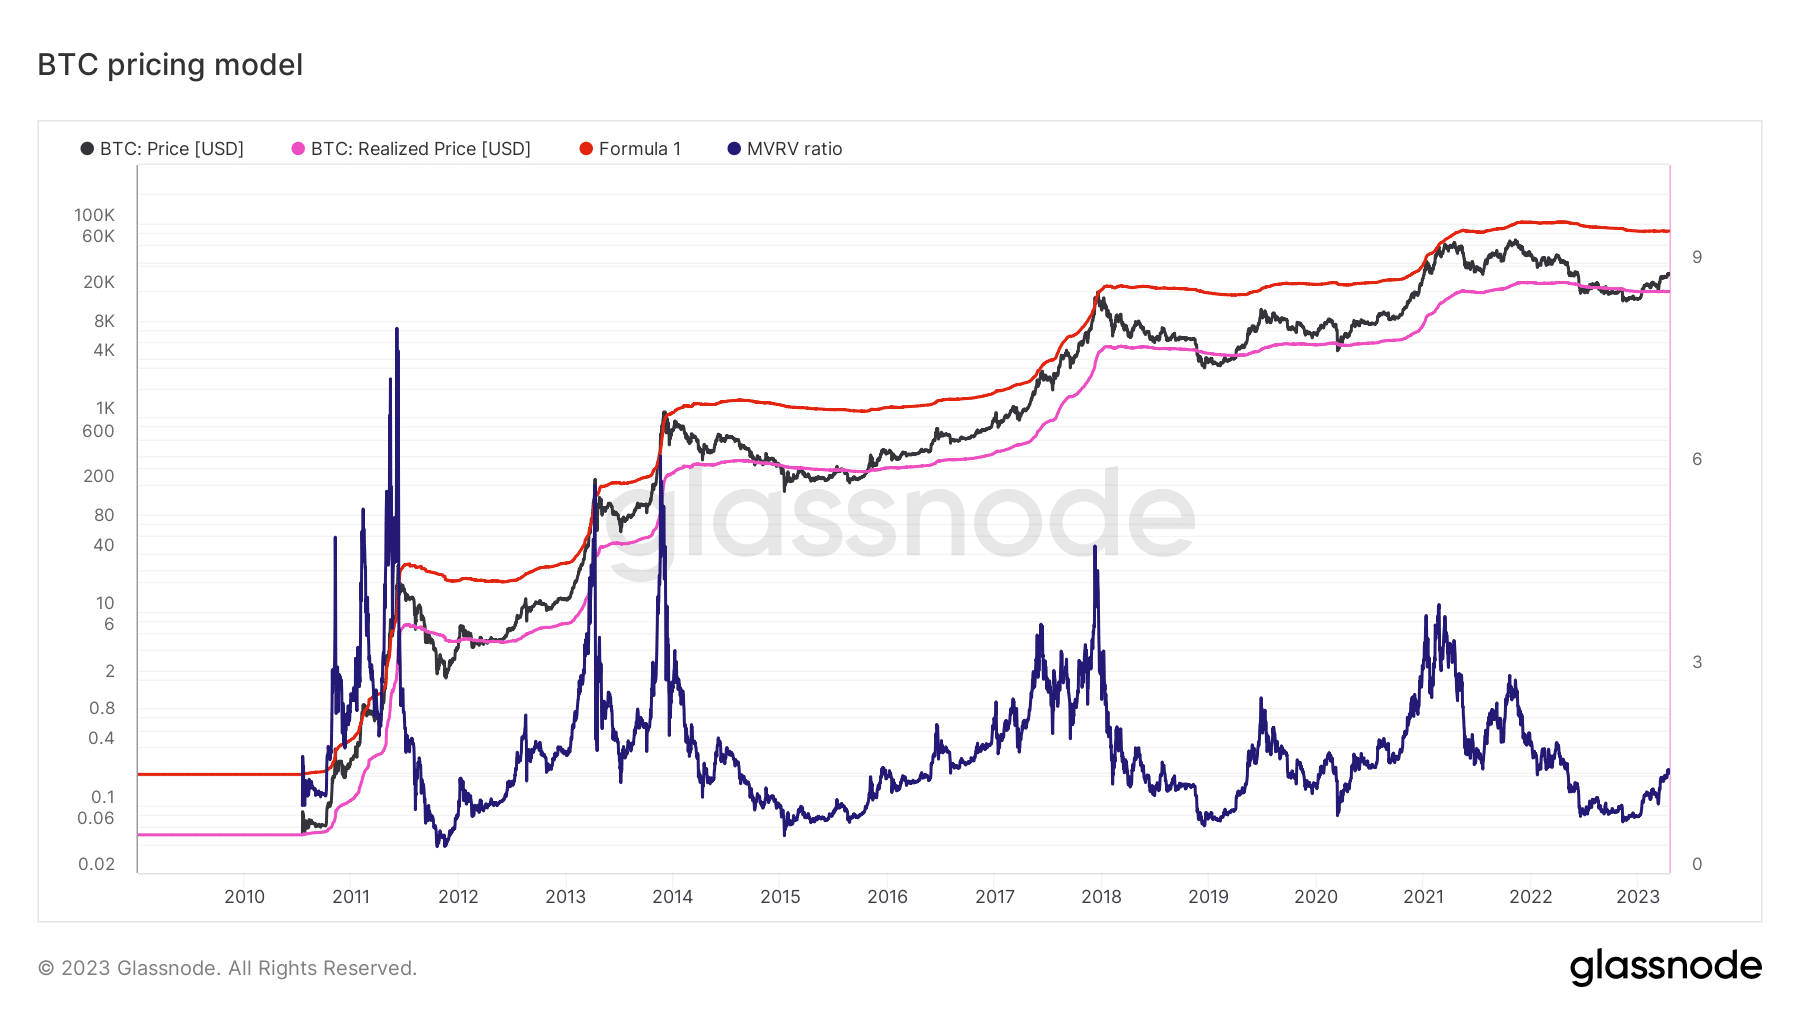
BTC crossed above its $19,714 realized price in January. Only a few months have passed since then. The two charts suggested that there was an overall bullish expectation ahead which has already kicked off with the bullish performance so far.
Despite this, there still stood a non-zero chance of a black swan possibly causing an massive unexpected selloff. On the flip side, an unexpected white swan may hasten the rally.