Is Chainlink ready for a major breakout? Analysts suggest $25 target

- LINK has surged by 7.7% leading to optimism among analysts.
- Despite the price surge, market sentiment remain bearish with little bullish signal.
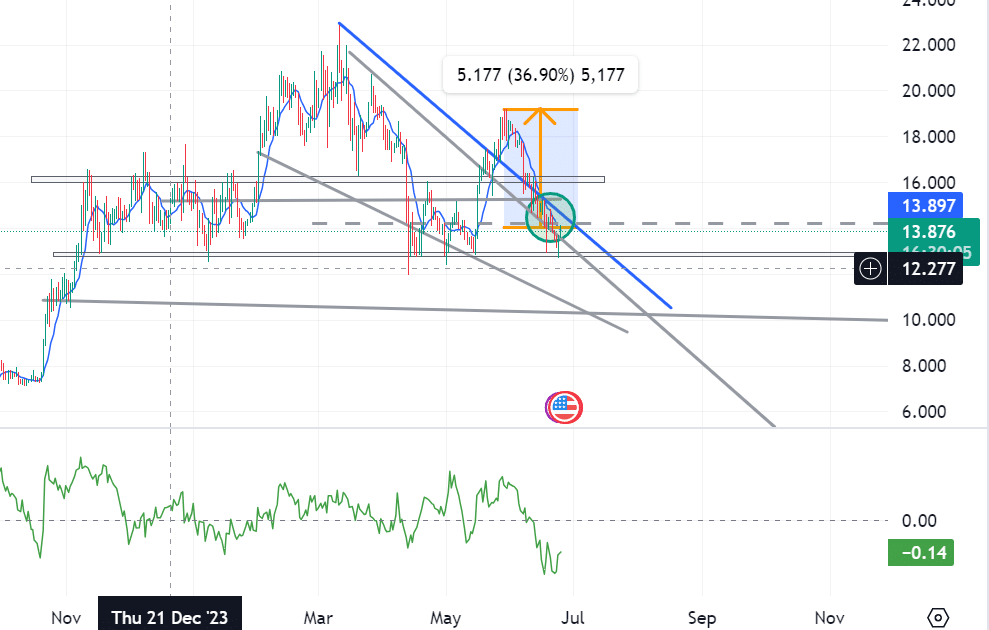
After weeks of decline, Chainlink [LINK] has experienced a strong upswing. In the recent turn of events, it has moved past the support level of around $12.96. With the move from this zone, the bulls are looking toward a sustained uptrend despite altcoins’ volatility.
Recent market activities have captured various crypto stakeholders, resulting in speculations and bold predictions. One notable analyst, World of Charts, shared that LINK was,
“finally heating up still consolidating within the falling wedge. The more it will consolidate, the higher it will go after the breakout, still expecting a move towards 22-$25”.
This bold prediction sees a sustained bullish trend after a breakout from the current zone.
Also, the widely recognized Chainlink analyst @Linktoad General HBARI shared on X that,
“After 110 days, the LINk USDlongs chart is finally capitulating…If we compare to ETH , ETH proceeded to run 271% past the Old ATH for 57 days. If we apply this same metric to the LINK price we chart, we would get a price of $47-$49.”
This analyst uses the past data to predict the future, positing that LINK will reach a new ATH. If the current conditions persist
What does LINK fundamentals tell us?
At press time, LINK was trading at $14.01, a 7.7% surge in 24 hrs. In the same period, its trading volume has increased by 102.25% to $444M. According to Coinmarketcap, LINK’s market cap has surged to $8.5 billion in 24 hrs.
However, the overall market sentiment remains bearish.
Despite the optimistic predictions, AMBCrypto analysis shows LINk price movements have shown little bullish signals in the last 24 hours.
Looking at CMF, LINK has a negative CMF, which indicates a bearish market sentiment. As of the time of writing, LINK’s CMF stands at -0.13.
A negative CMF shows increased selling pressure, meaning money flows out of assets.
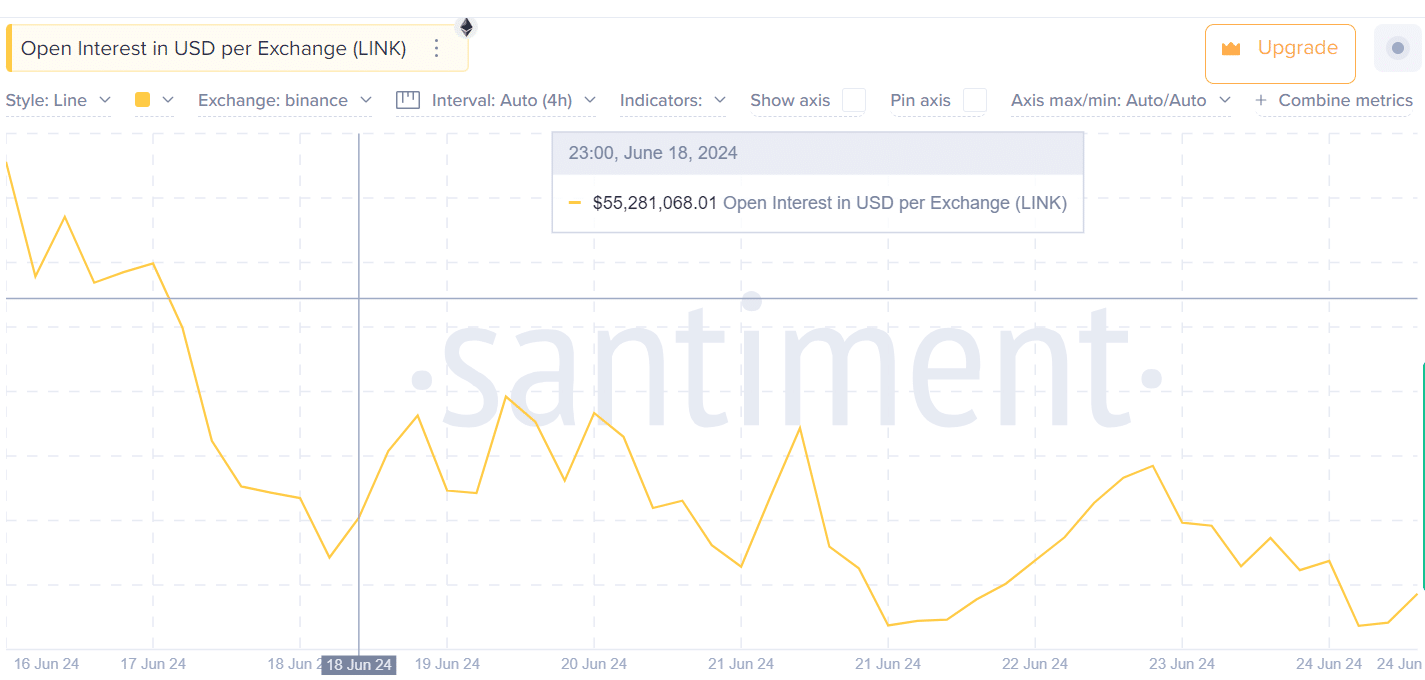
Also, AMBCrypto analysis of Santiment data shows declining open interest per exchange from $63k on the 16th to $53k on the 24th.
The declining open interest implies investors are closing their positions without opening news. Investors fear market volatility and indecisiveness may push them to avoid new positions.
Also, our analysis of Coinglass shows that the OI-weighted funding rate has experienced high volatility.
At press time, LINK reported an OI of 0.0094% after reporting -0.0007 on the 22nd and -0.0044 on the 23rd, which shows a potential reverse to a bullish market after a sustained bearish trend.
Can ChainLink maintain its recent surge?
These price movements show an upward movement from the resistance level of around $12.9. Equally, the charts show a strong movement above the bearish trendline of around $13.661.
Realistic or not, here’s LINK market cap in BTC’s terms
The breakout from these zones positions LINK to challenge the next resistance level around $14.205 and reach $15.50 in a more bullish scenario.
However, if LINK fails to achieve the $14.205 target, it will experience correction and decline to around $12.939.


