Is Dogecoin’s bottom here? Why DOGE could break above $0.10
The CVDD Signal and the deeply oversold long-term RSI suggested the DOGE market bottom was in.



In January, Dogecoin [DOGE] had rallied to a high of $0.156 before the bear market pressure forced the leading memecoin lower. At the time of writing, Dogecoin was still 41% down from the 2026 high.
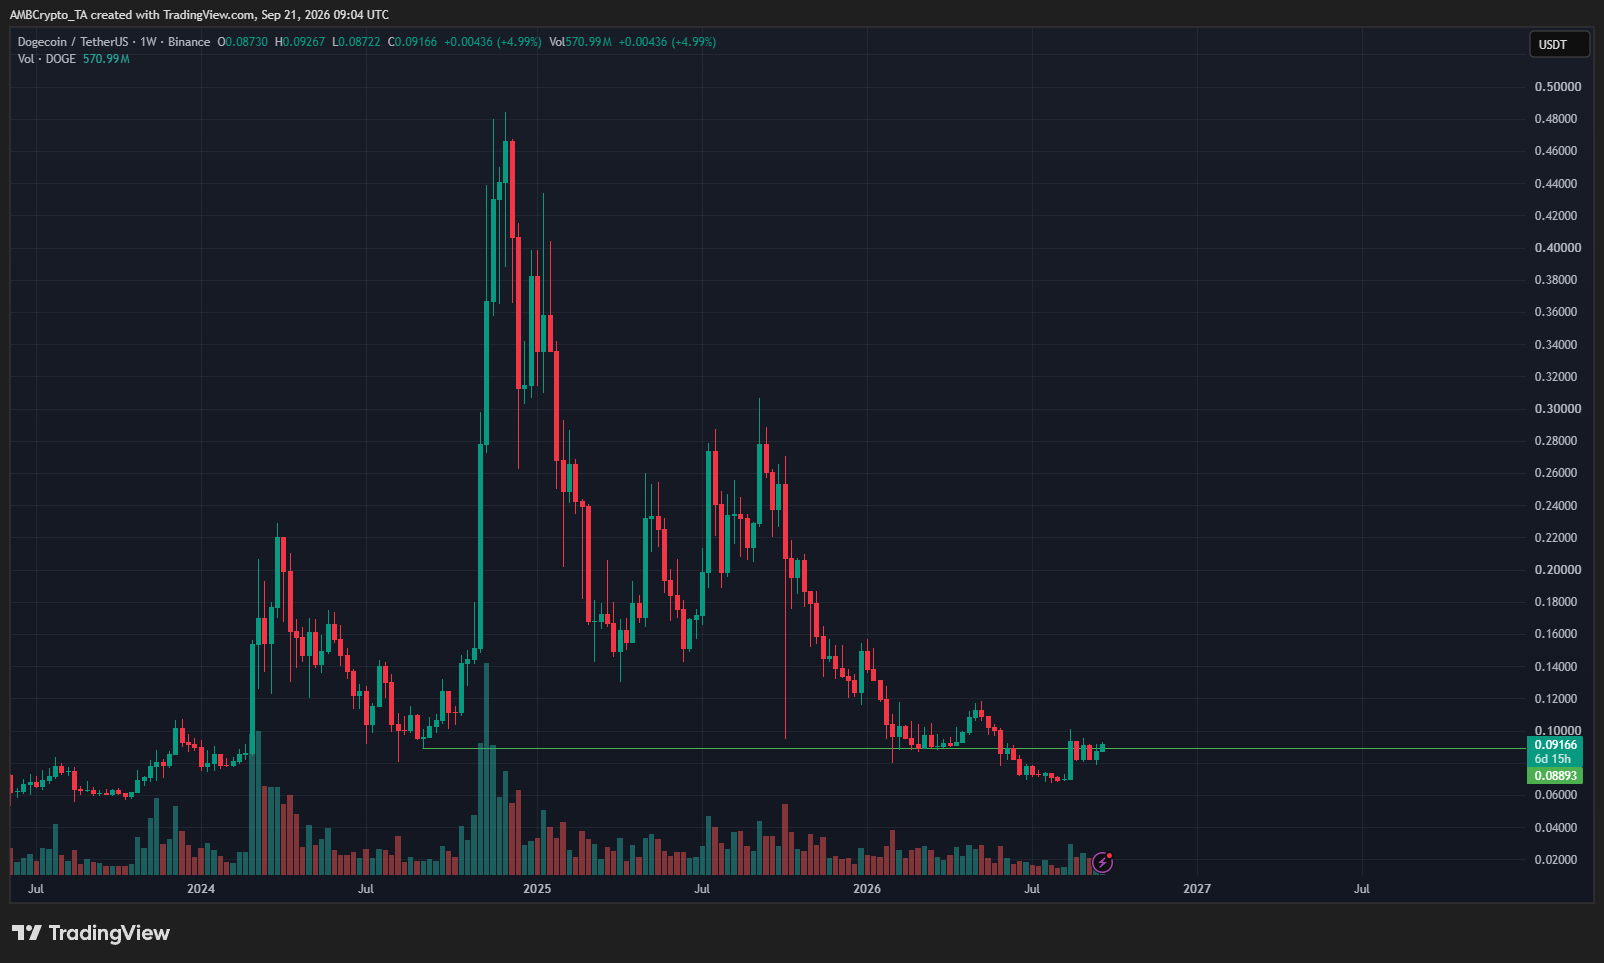
The higher timeframe trend might be bearish, but it is starting to recover. There is much more bullish hope in the crypto markets. The Fear and Greed Index has been in greed territory for a month.
Bitcoin [BTC] was back above the $82,850 high from May, sparking a long-term bullish structure. Notably, there are other signs that show Dogecoin is in a good place to buy.
DOGE season is starting
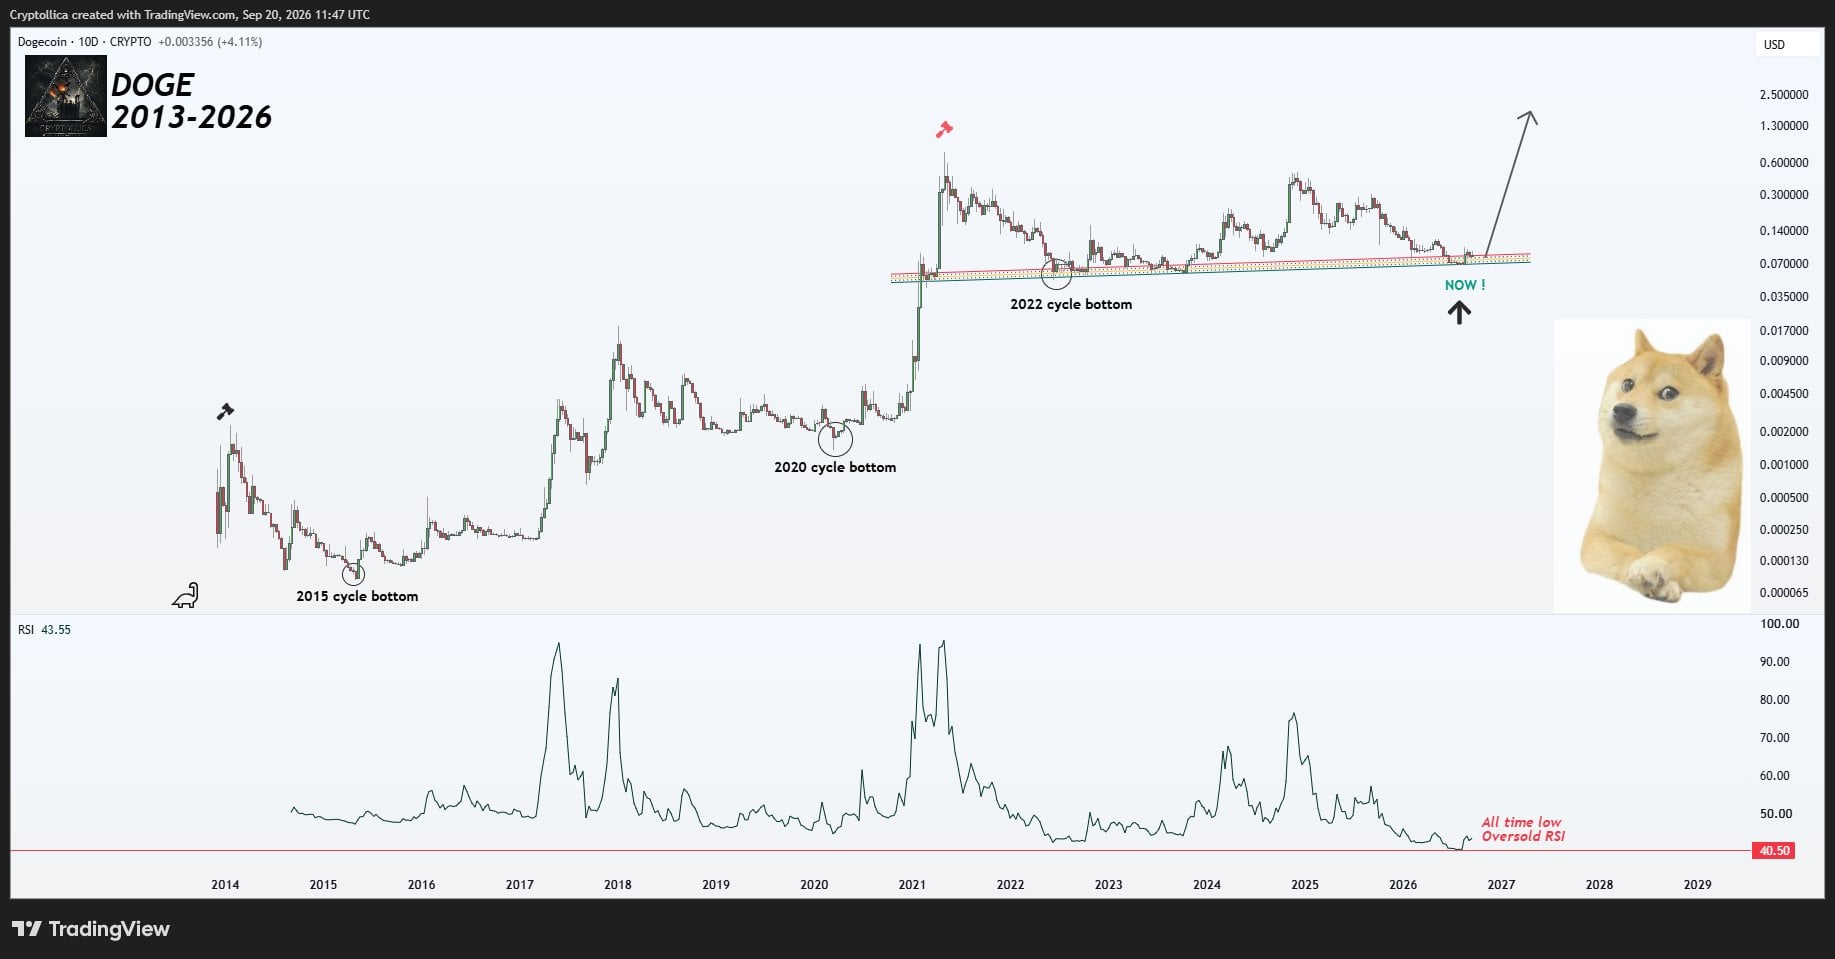
A crypto researcher claimed a Dogecoin season is about to start. The 10-day RSI was recovering from reaching its lowest-ever readings. It was lower than any previous major market bottom, making DOGE a potential value buy.
There was also a rising channel that has acted as a major support zone since 2021, which was retested by DOGE in recent weeks and respected so far.
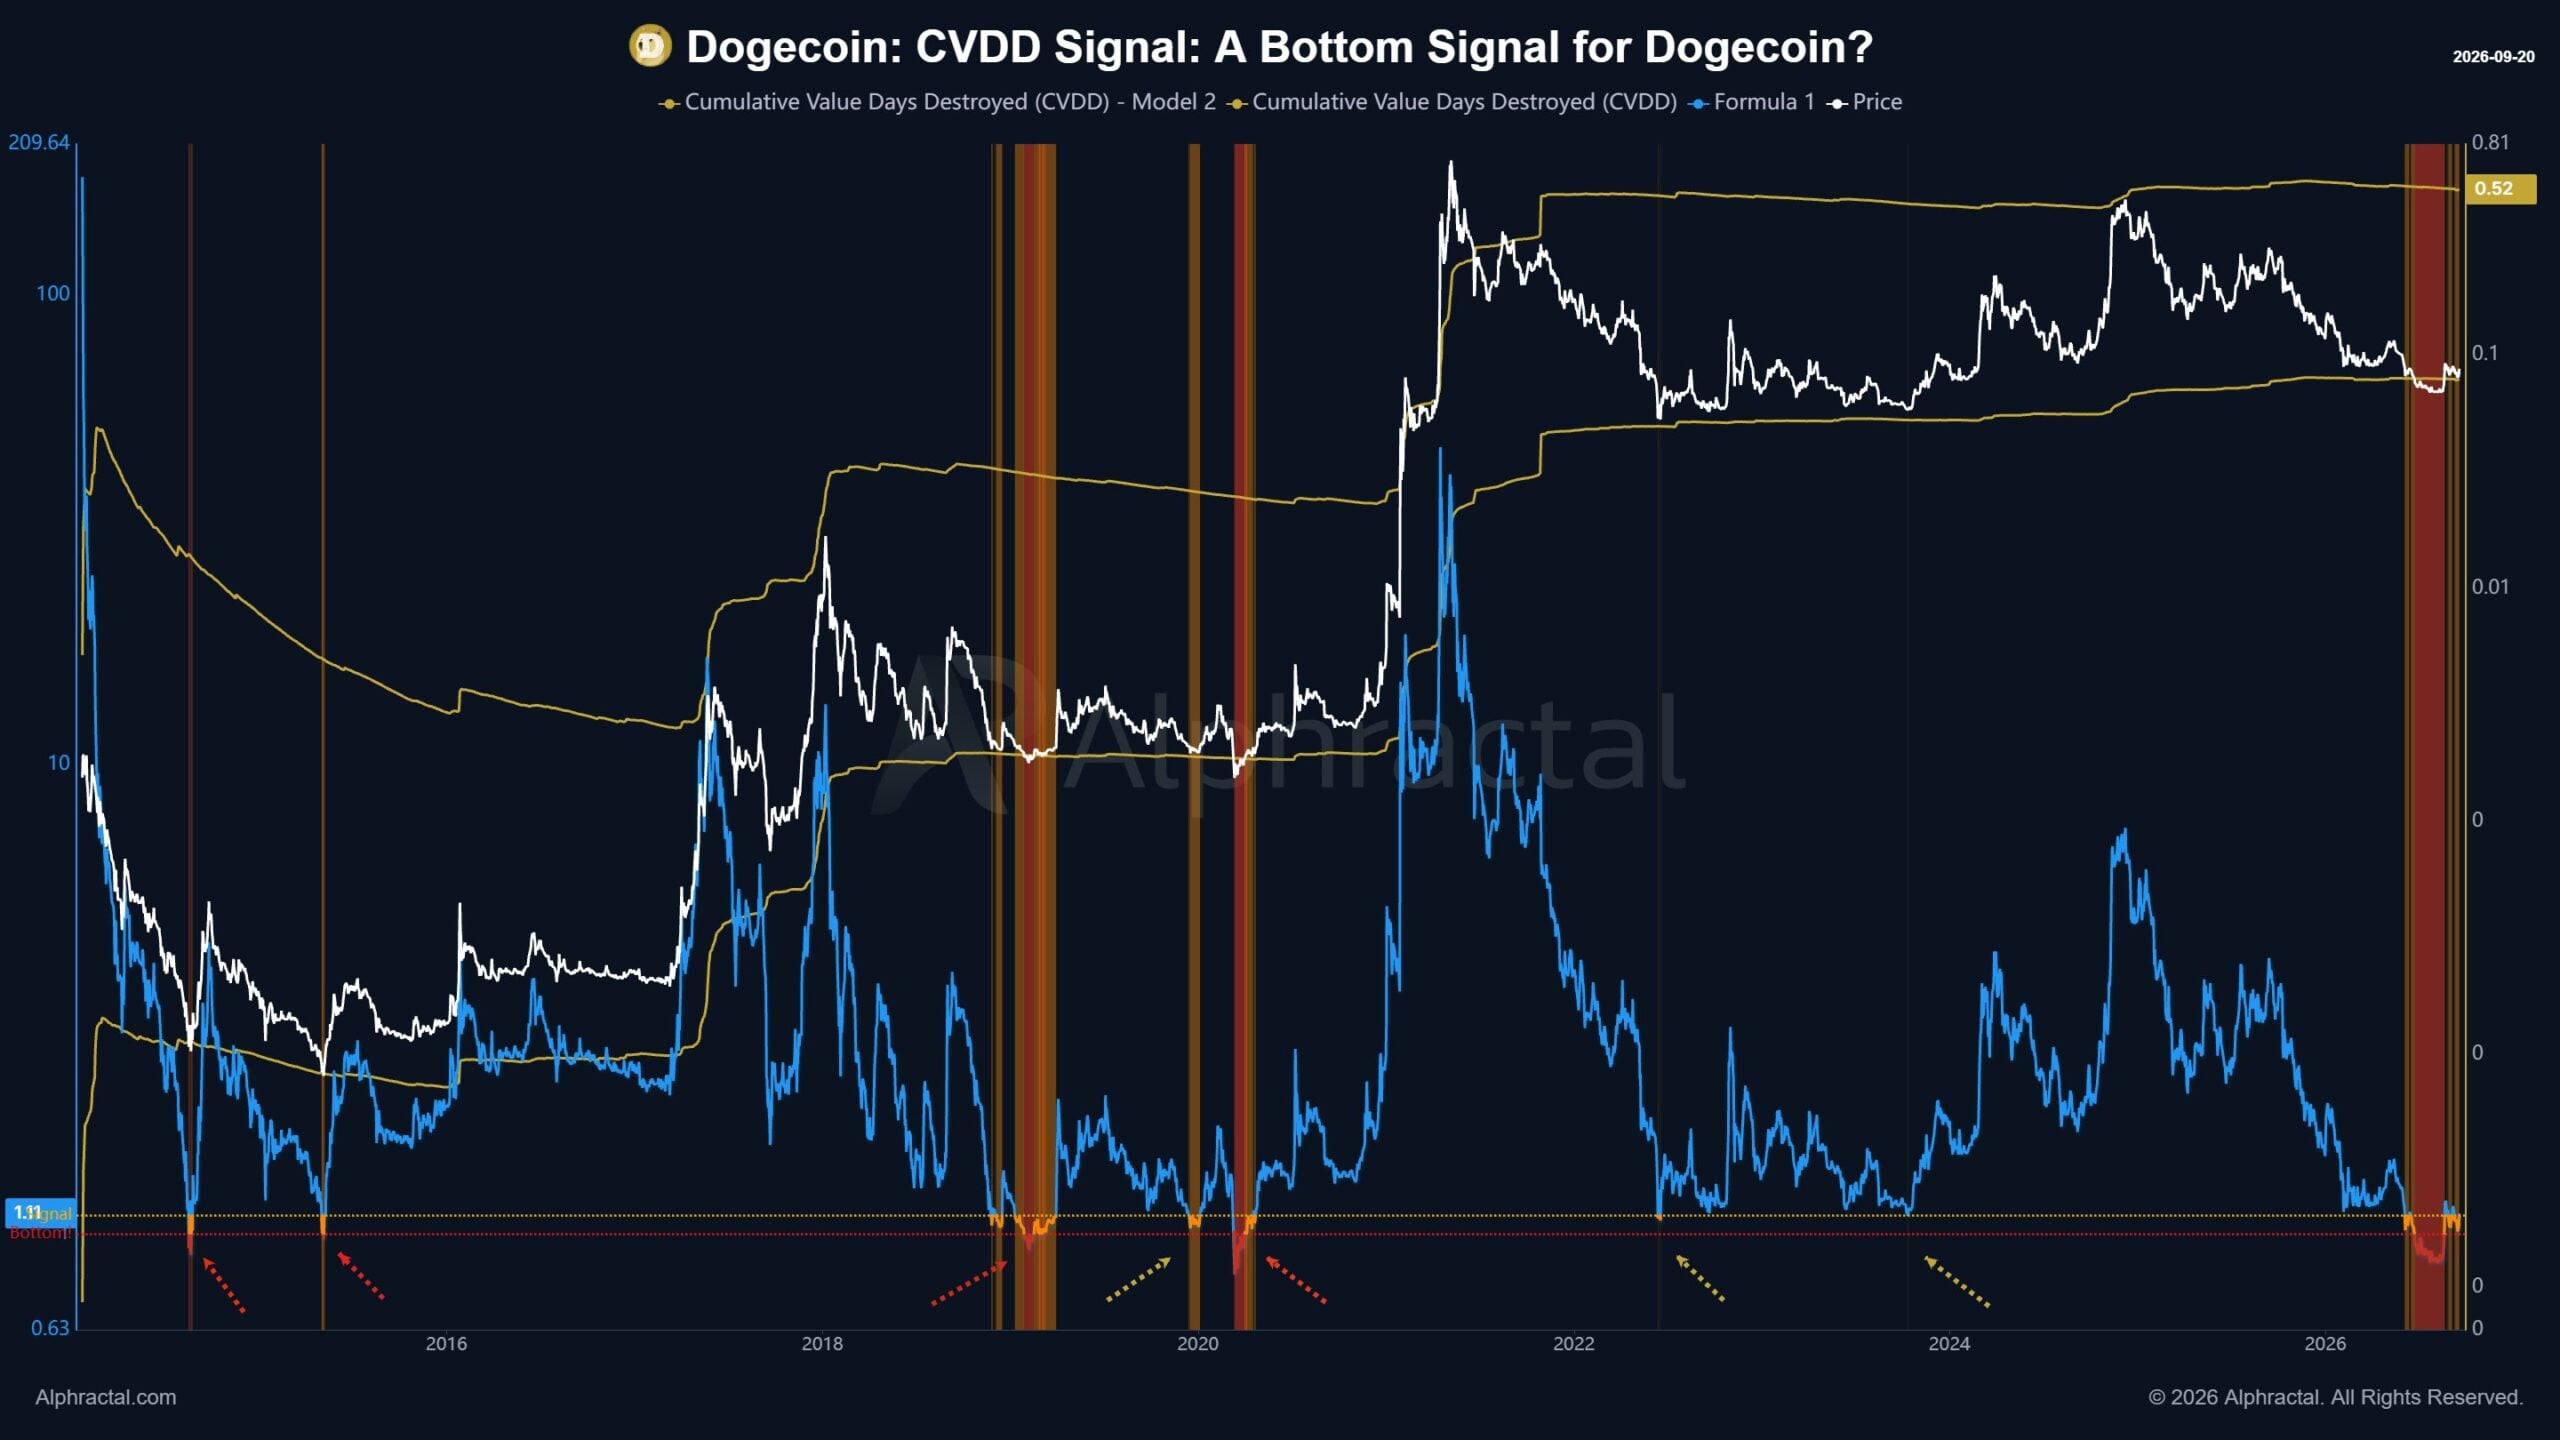
The Dogecoin Cumulative Value Days Destroyed (CVDD) tracks the transfer of old coins and helps track the cumulative sum of the value-time destruction in the market as coins change hands.
This metric can help mark major market bottoms and historic levels of value transfer among market participants. Crypto analyst Joao Wedson pointed out in June that Dogecoin had reached a bottoming phase when it triggered a CVDD signal by falling below $0.08.
Dogecoin has finished forming a bottom
The leading memecoin fell to a low of $0.067, but has rebounded back to the $0.092 swing point since then.
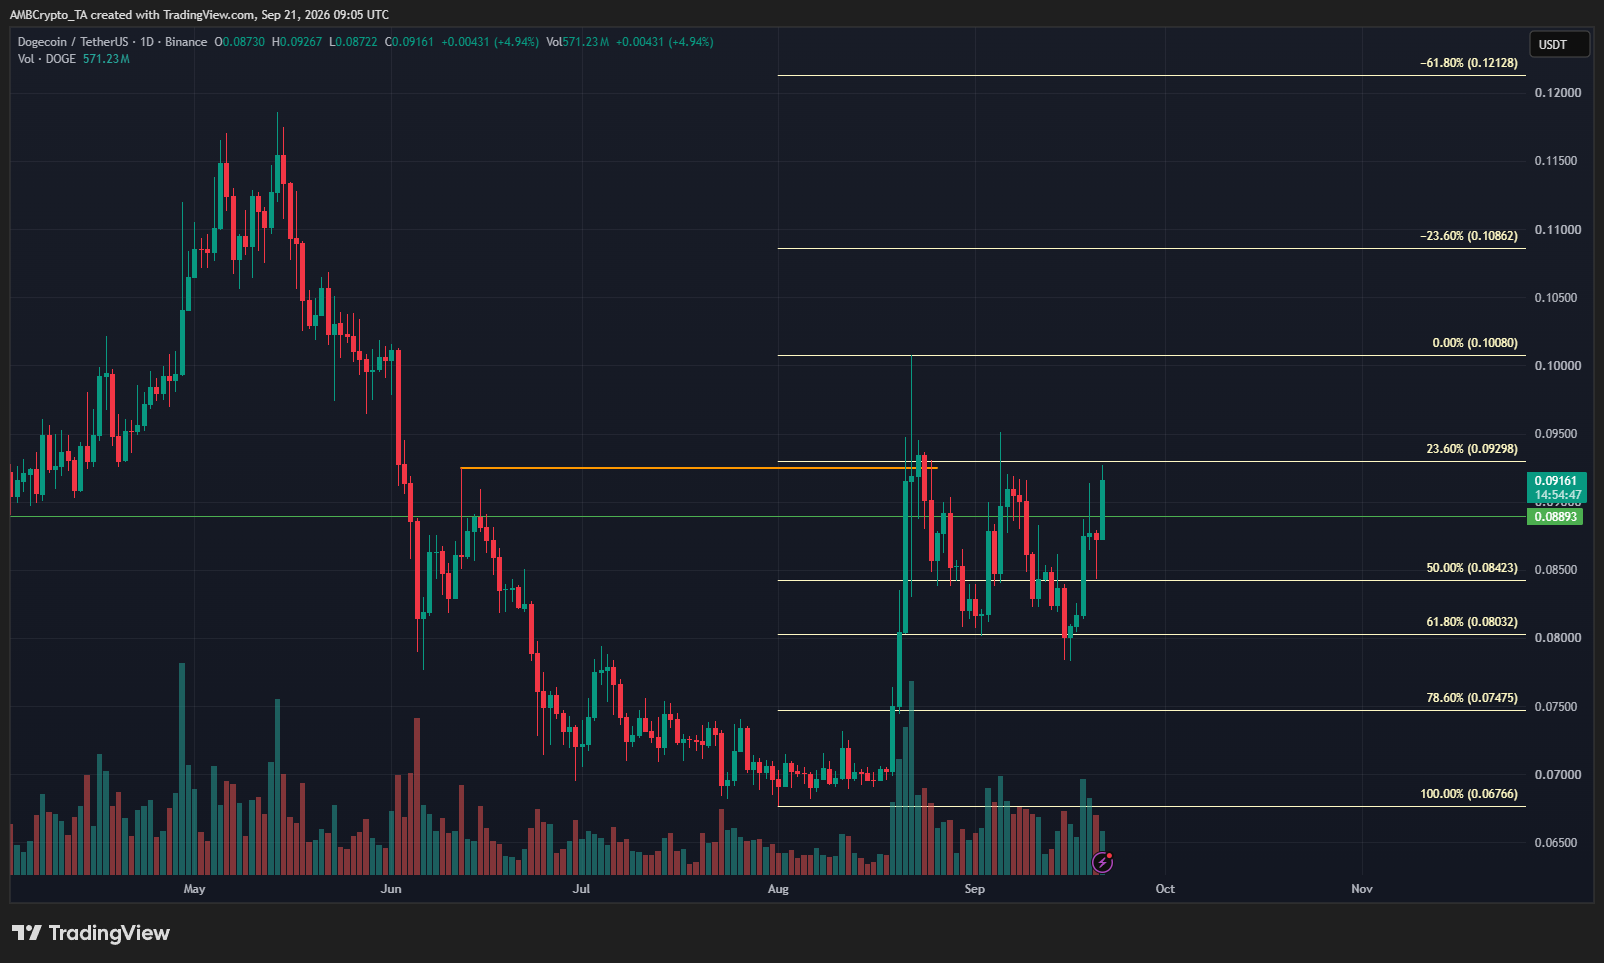
Its swing structure was bullish on the daily timeframe, and the $0.10 psychological round-number supply zone could soon be breached. Traders and investors need to watch out for heightened trading volume to signal a breakout.
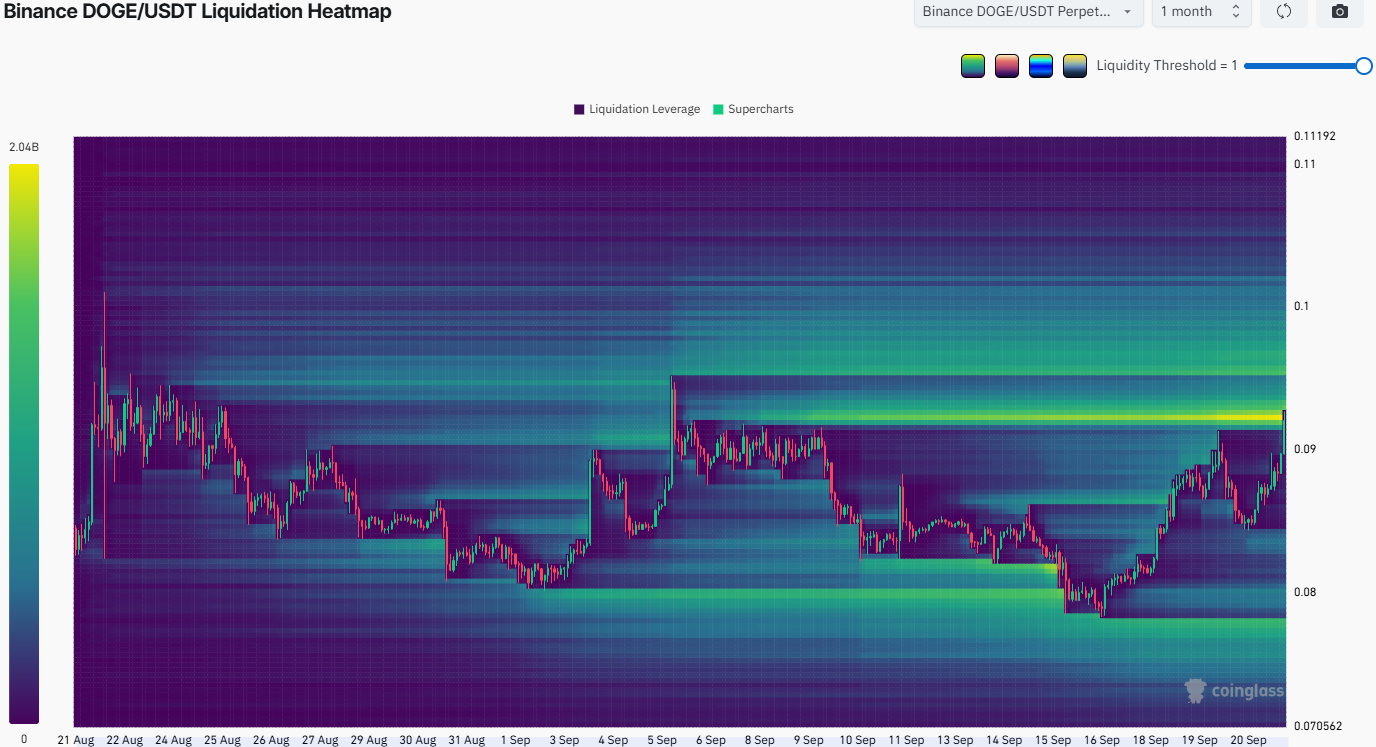
On the derivatives side, the cluster of short liquidations around $0.092 has been taken out. Therefore, Dogecoin may consolidate for a brief period before continuing higher.
A deep pullback below $0.08 once again appeared unlikely, based on the evidence at hand.
Final Summary
- The Dogecoin price rally was approaching the $0.10 psychological supply zone.
- The CVDD signal and the deeply oversold long-term RSI suggested the DOGE market bottom was in.