Ethereum

Is Ethereum turning bullish? This indicator is the key
Posted:
| Last updated: April 24th, 2024
Journalist

- Ethereum’s Taker Buy Sell Ratio attempts to breach the center line in an uptrend.
- However, bearish sentiments continue to grow.
Ethereum’s [ETH] Taker Buy Sell Ratio is poised to cross above its center line, signaling a rise in bullish sentiment amid recent market troubles, data from CryptoQuant has shown.
The Taker Buy Sell Ratio is a metric that measures the ratio between the buy volume and sell volume in an asset’s futures market.
A value greater than 1 indicates more buy volume than sell volume, while a value less than 1 indicates more sell volume than buy volume.
At press time, ETH’s Taker Buy Sell Ratio was 0.96, per CryptoQuant’s data.
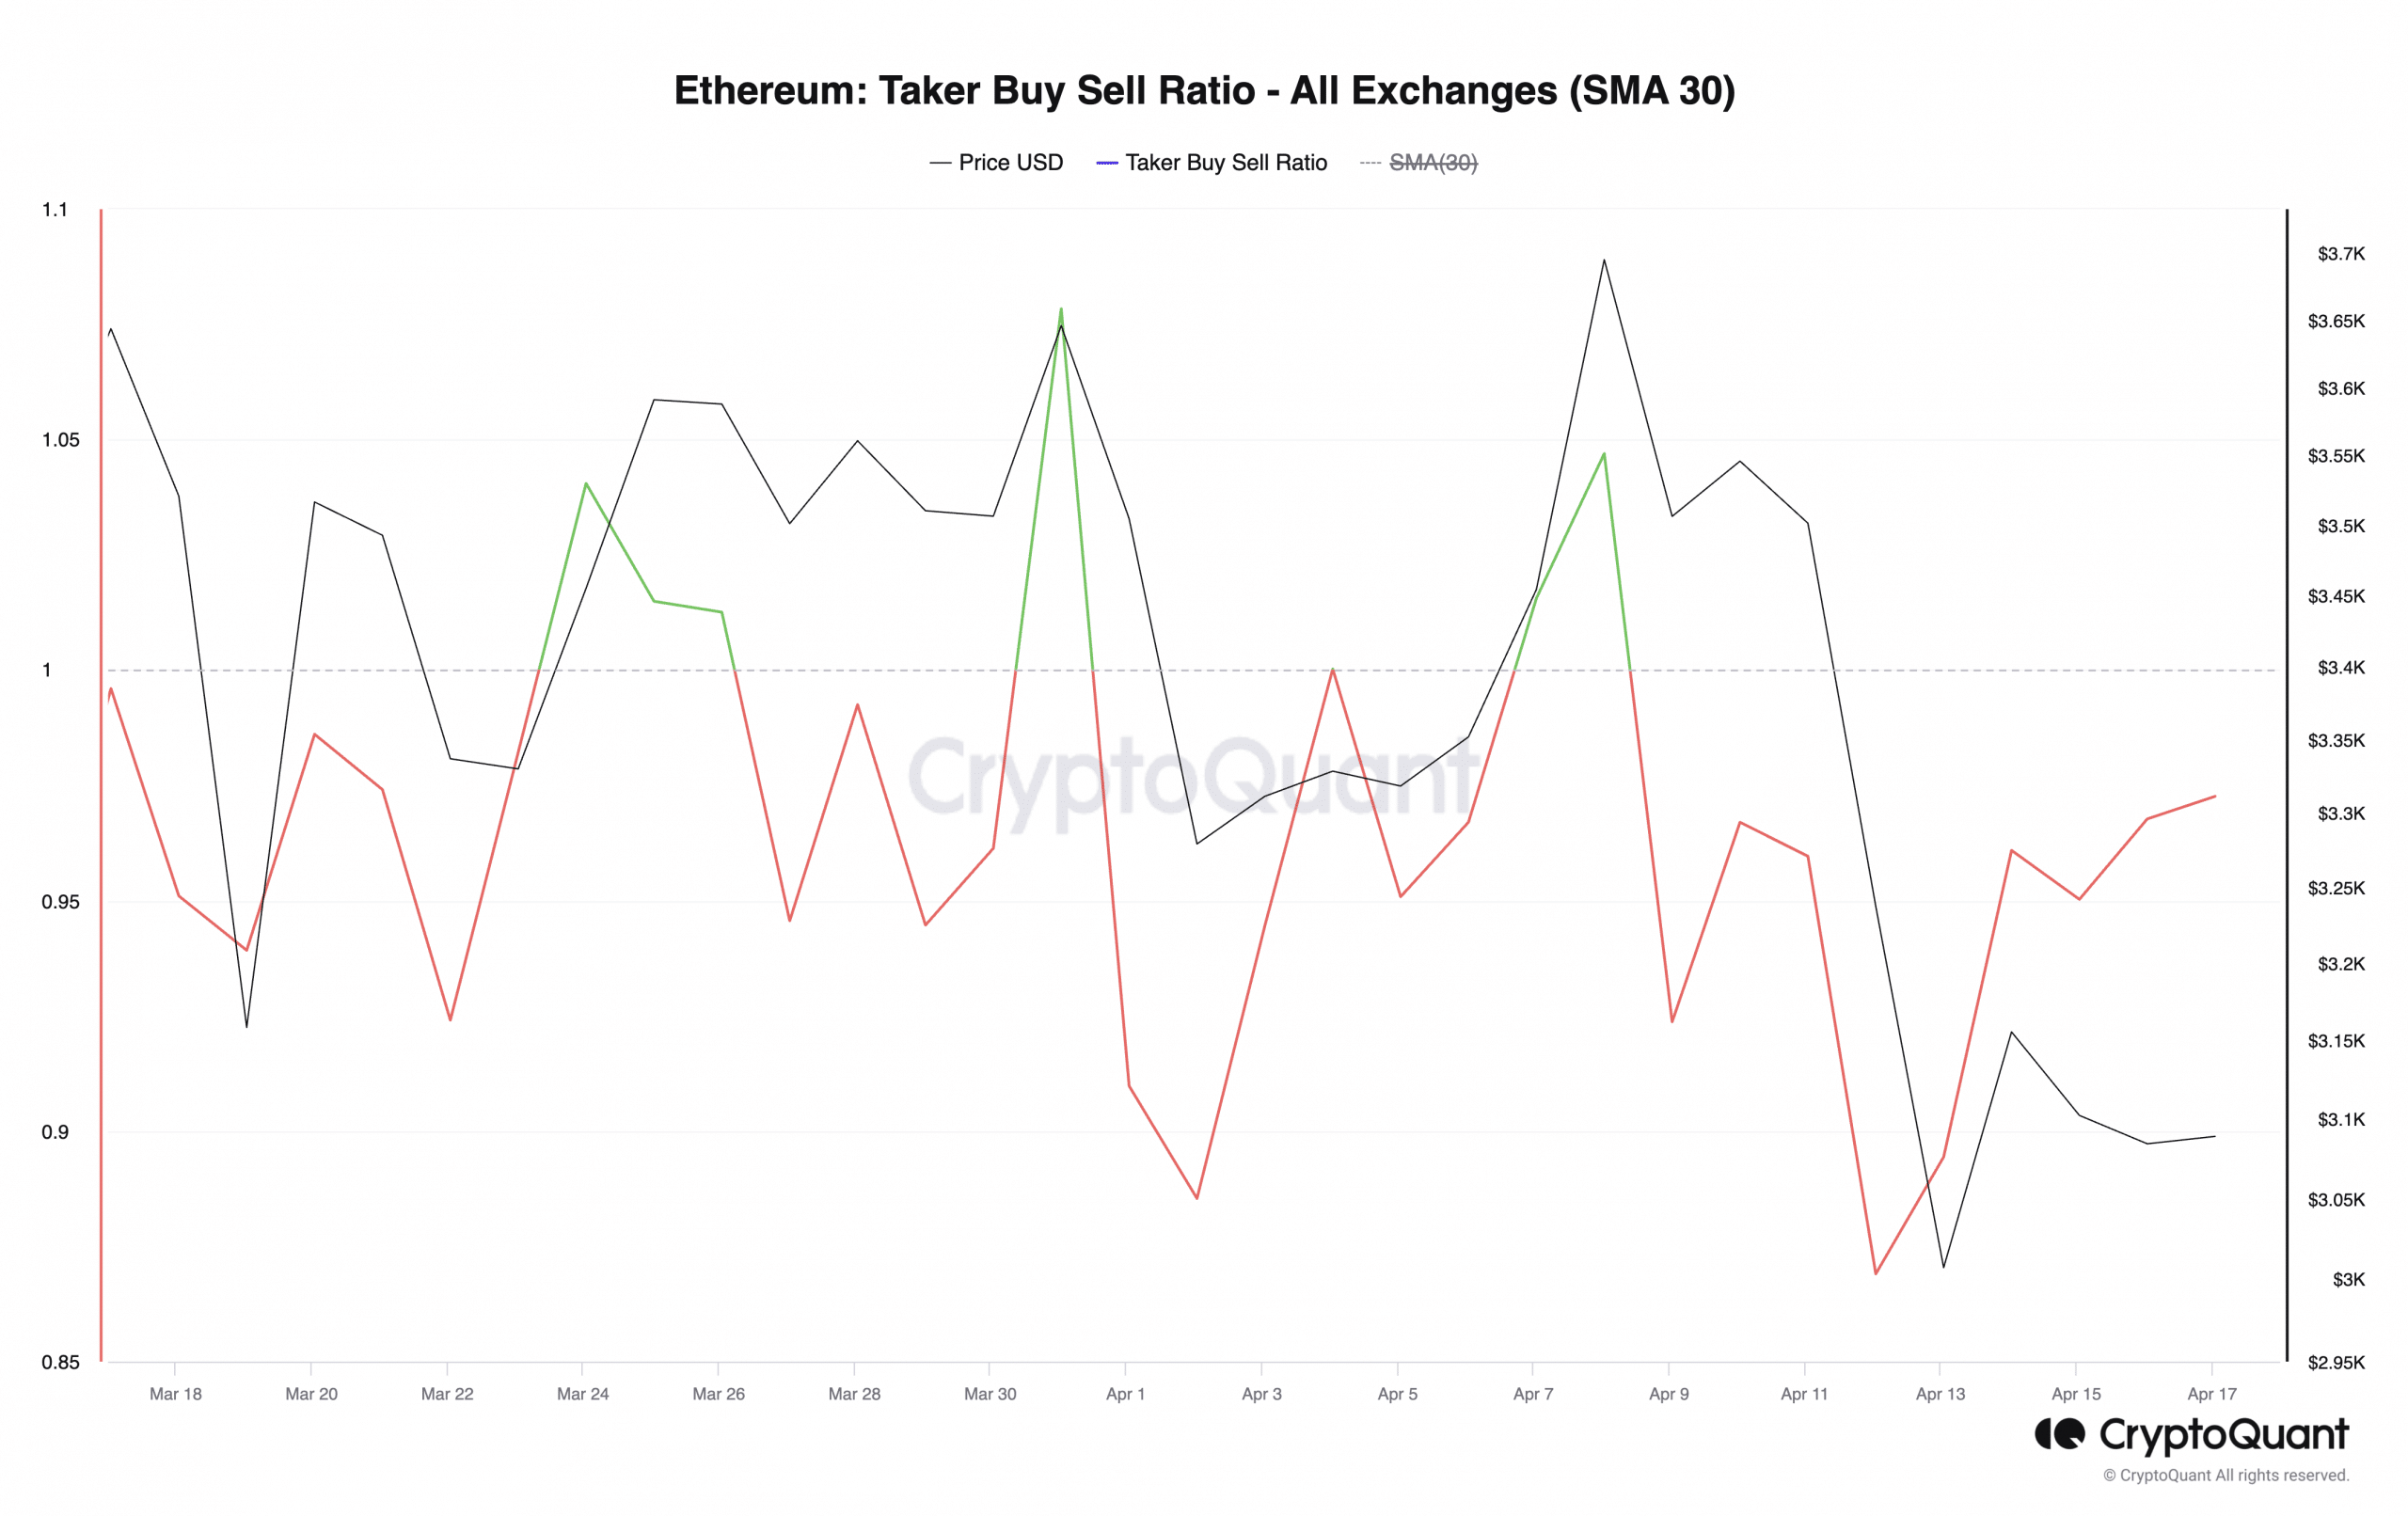
Source: CryptoQuant
The bears remain in control
Despite the spike in ETH’s Taker Buy Sell Ratio, an assessment of the coin’s spot and futures markets revealed that bearish sentiments remain significant.
For example, ETH’s Futures Open Interest has fallen to its lowest since the 28th of February, according to Coinglass data. It peaked at $15 billion on the 9th of April and has since declined.
At $11 billion as of this writing, ETH’s Open Interest has plummeted 27% in the last seven days.
An asset’s Open Interest measures the value of its Futures contracts that are yet to be closed.
When it declines this way, it suggests that market participants are closing their positions and exiting the market without opening new ones.
During the last week, ETH’s funding rates briefly turned negative on 14th April, when a significant number of market participants opened trades against the coin’s price.
This marked the first time ETH would record a negative Funding Rate since the bull market rally began in October 2023.
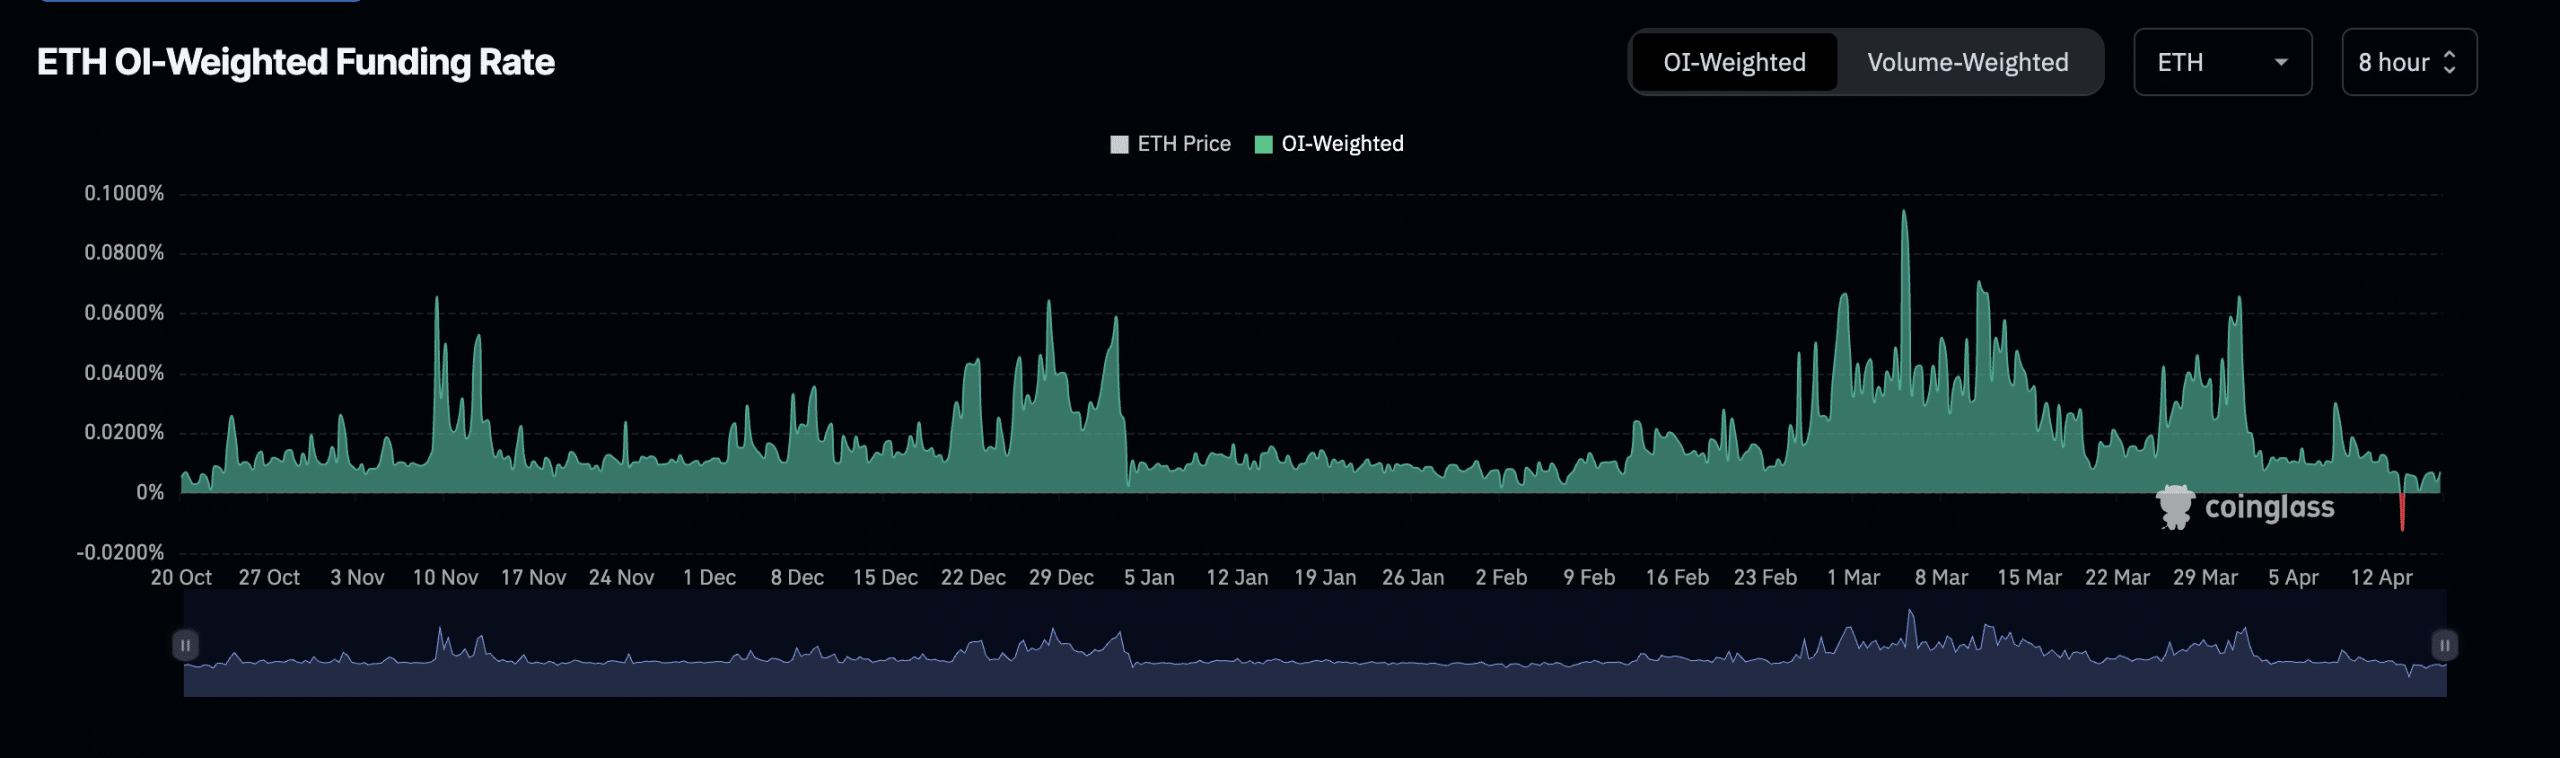
Source: Coinglass
In its spot market, key technical indicators observed on a daily chart hinted at the possibility of a decline below $3000 if bearish sentiments linger.
ETH’s Awesome Oscillator, which measures market momentum, posted downward-facing red histogram bars at press time. This trend has been present since 13th April.
Downward-facing Red bars on an asset’s Awesome Oscillator are often interpreted as a bearish sign, suggesting a hike in selling pressure.
Likewise, readings from ETH’s Parabolic Stop and Reverse (SAR) showed the dots that make up the indicator resting above the coin’s price.
Read Ethereum’s [ETH] Price Prediction 2024-25
The Parabolic SAR indicator is used to identify potential trend direction and reversals.
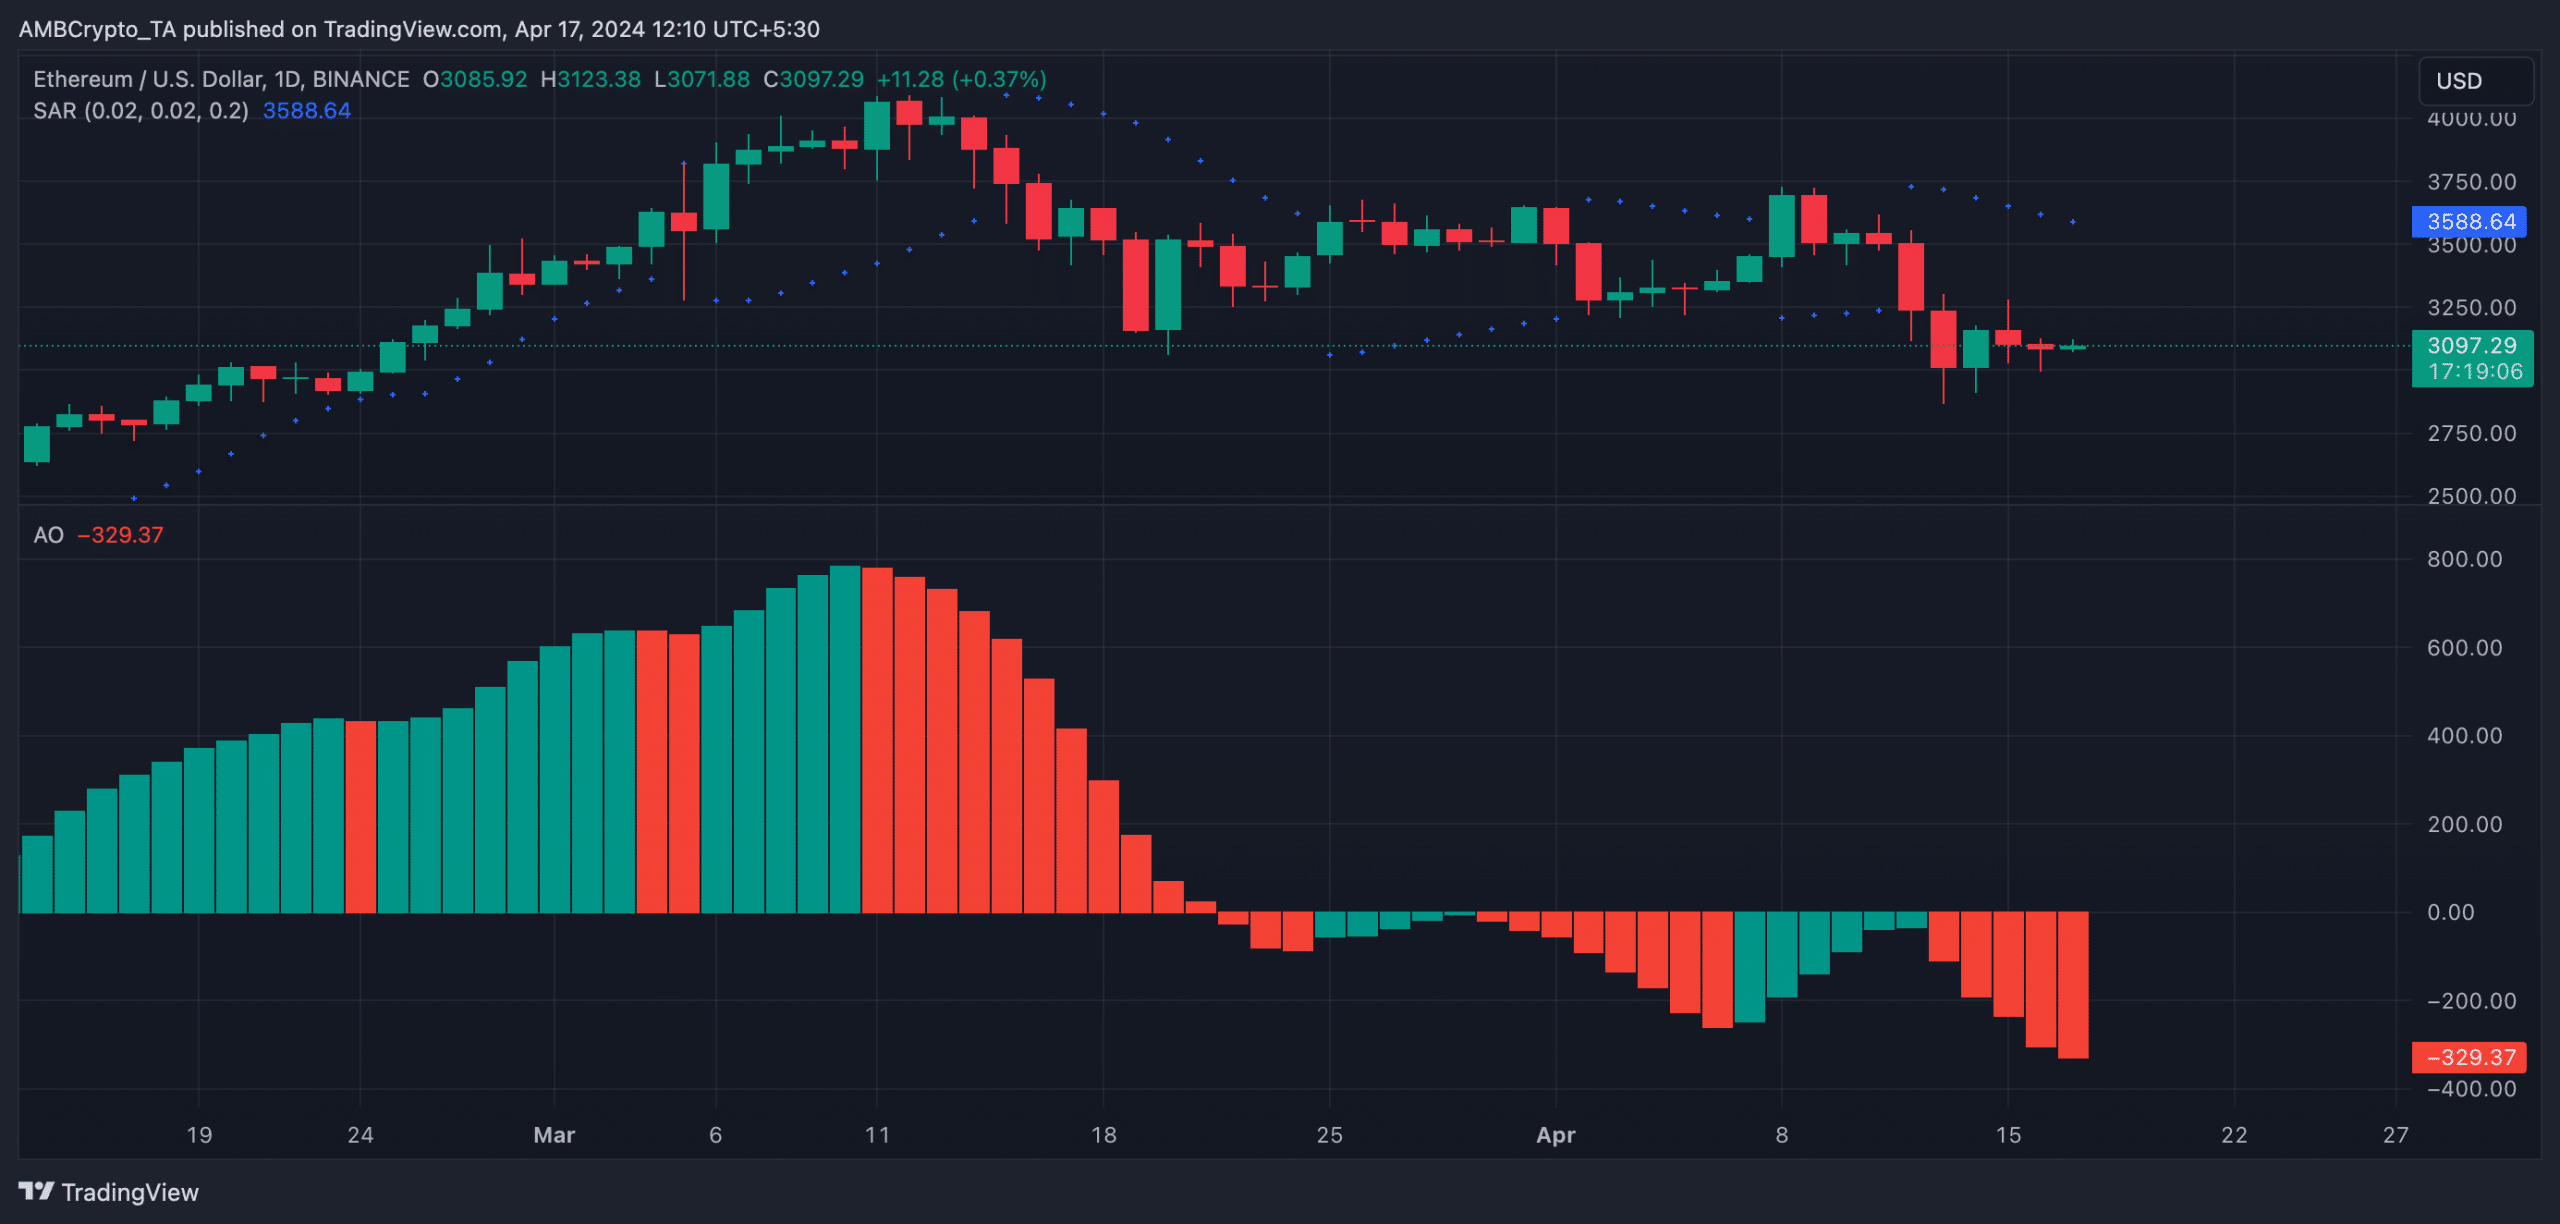
Source: ETH/USDon TradingView
The market trend is considered bearish when its dotted lines are placed above an asset’s price.