Is Ethereum’s market bottom in? Price indicators point to a $5K target
The Pi Cycle Top indicator revealed that ETH’s price had hit a market bottom, hinting at a bull rally.

- Ethereum’s price action finally turned bullish in the last 24 hours.
- Selling pressure on Ethereum increased last week.
The actions of whales have a major impact on crypto prices, including those of top coins like Ethereum [ETH]. The latest analysis rightfully pointed out one such interesting development. Separately, a key ETH metric suggests that investors might soon witness a price hike.
Ethereum and Bitmex’s connection
BlitzzTrading, an analyst and author at CryptoQuant, recently posted an analysis highlighting a unique trend. As per the analysis, following sharp increases in Ethereum reserves, noticeable decreases in the ETH price are observed.
For instance, on the 28th of September, there was a massive decline in Bitmex exchange reserves, which was followed by an increase in the ETH price.
This correlation between ETH and Bitmex meant that when Bitmex Ethereum whales buy through Bitmex, we observe a decrease in reserves.
Conversely, when they sell, we see an increase in Bitmex reserves. At press time as well, Bitmex’s ETH reserves remained relatively low.

Ethereum at a market bottom
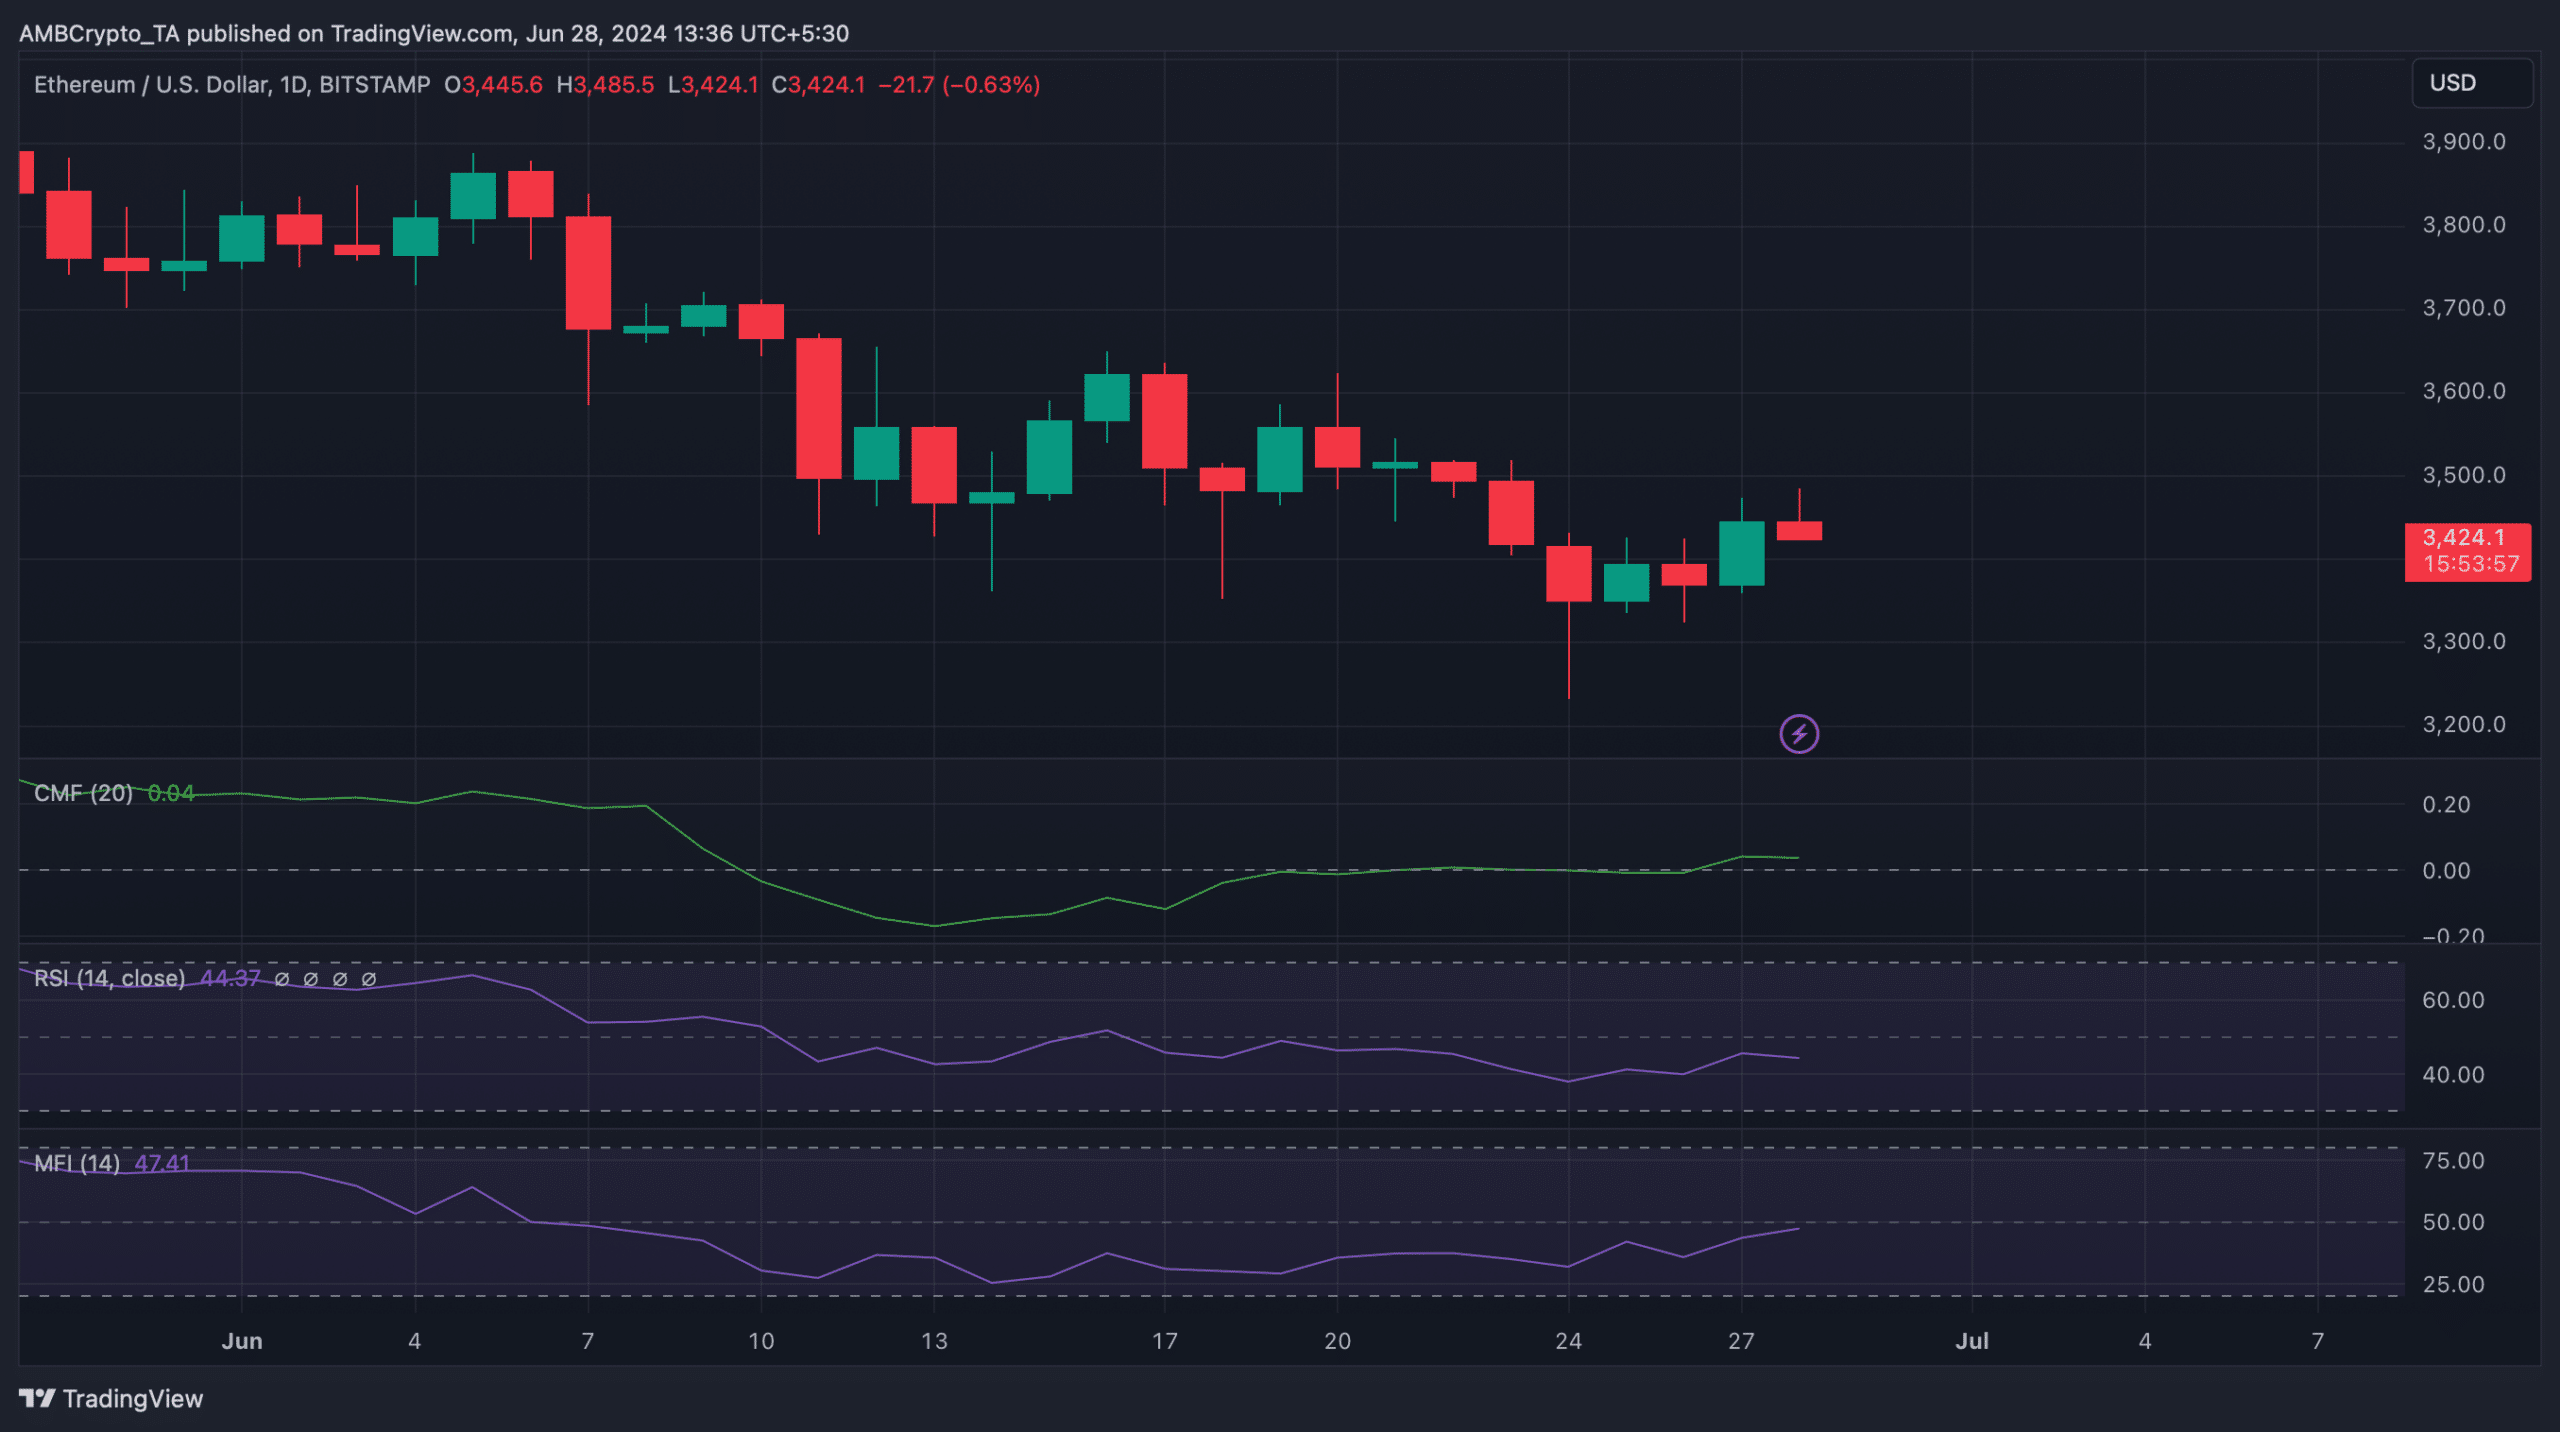
In the meantime, Ethereum’s price finally managed to turn bullish after several days of corrections. According to CoinMarketCap, ETH’s price increased by nearly 2% in the last 24 hours.
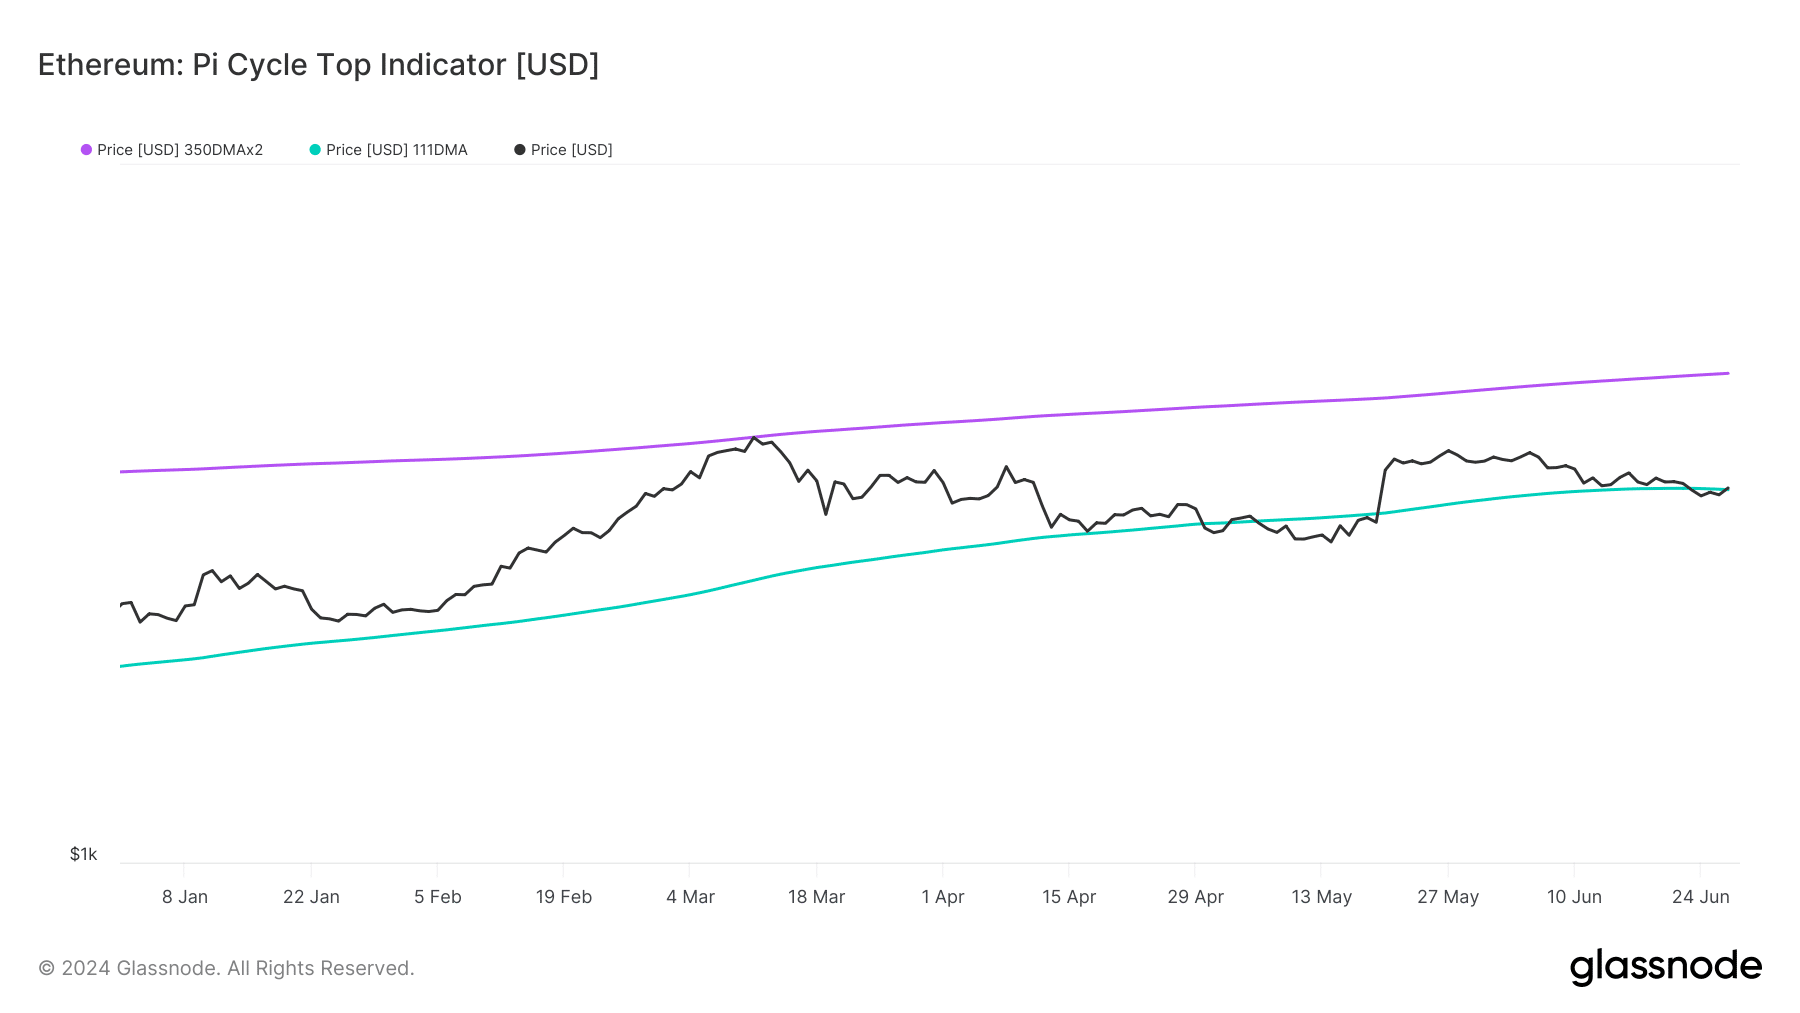
At the time of writing, ETH was trading at $3,428.69 with a market capitalization of over $412 billion. AMBCrypto’s look at Glassnode’s data also pointed out a bullish metric.
The Pi Cycle Top indicator revealed that ETH’s price had hit a market bottom, which hinted at a bull rally. If that turns out to be true on this occasion, then ETH might soon touch $5,000.
Apart from this, Ethereum’s fear and greed index had a value of 32% at press time, meaning that the market was in a “fear” phase. Whenever the metric reaches this level, it indicates that the chances of a price increase are high.
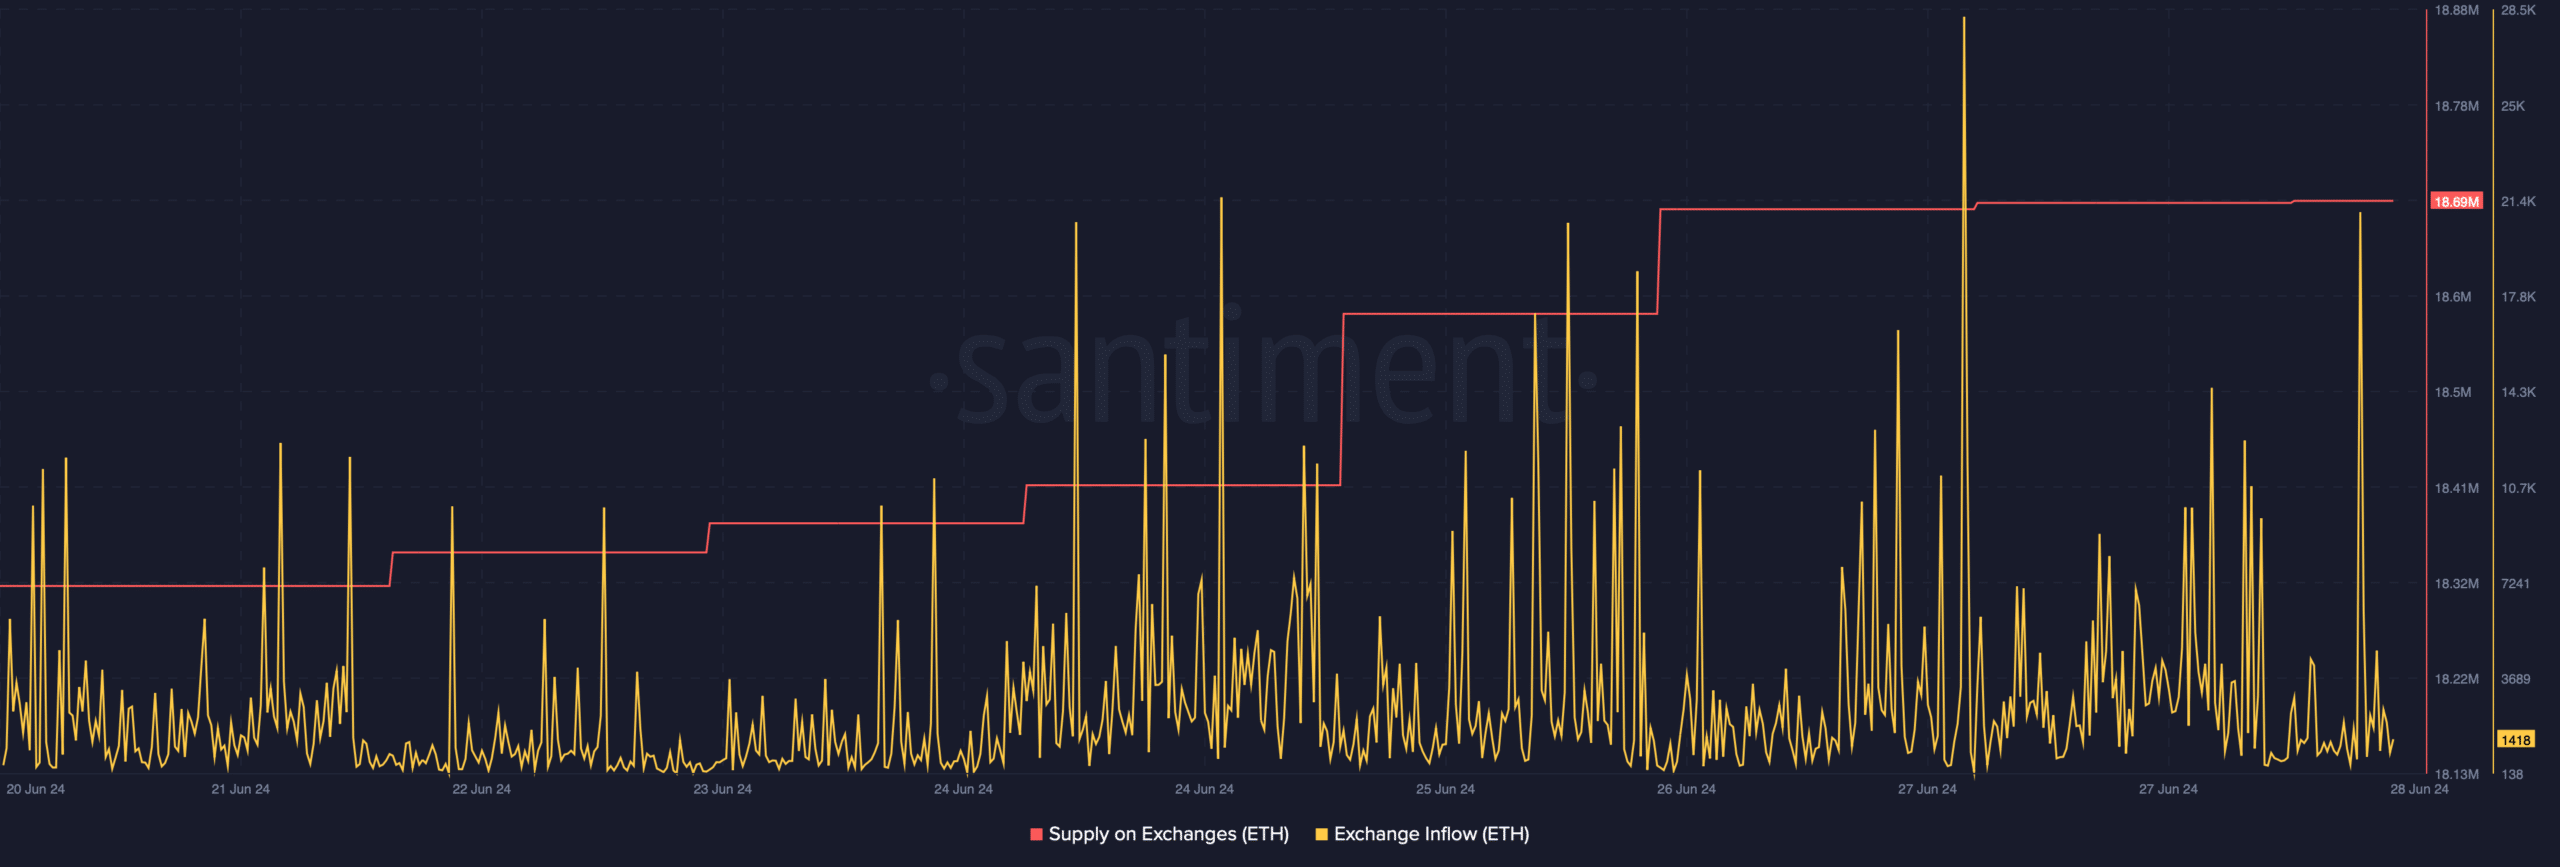
Nonetheless, Santiment’s data revealed that selling pressure on the token was high. This seemed to be the case as ETH’s supply on exchanges increased.
Additionally, its exchange inflow also spiked, signaling a rise in selling pressure, which might restrict ETH’s price from moving up.
Is your portfolio green? Check out the ETH Profit Calculator
Like the aforementioned metrics, a few of the market indicators also remained bearish on the token. For instance, both Ethereum’s Relative Strength Index (RSI) and Chaikin Money Flow (CMF) went sideways near their respective neutral marks.
Nonetheless, the Money Flow Index (MFI) looked bullish as it moved northward, indicating a continued price rise.