
- More whale addresses have accumulated ETH in the last few weeks.
- ETH’s bull trend has continued to weaken with the price drop.
Ethereum [ETH], which has been moving closer to a bear trend over the past few days, has presented a buying opportunity for large investors.
According to recent data, big wallets have acquired more Ethereum as the price declined, which is a bullish signal.
Whale addresses scoop up Ethereum
AMBCrypto’s analysis of some major Ethereum addresses revealed a slight increase starting from the end of the previous month. Specifically, wallets holding over 10,000 ETH showed growth beginning around the 19th of May.
At this point, the number of such wallets was approximately 952, and Ethereum was trading at around $3,074.
The number of wallets holding over 10,000 ETH grew from around 952 to approximately 980 as of this writing.
Despite the ETH price increase to around $3,700, these addresses have continued accumulating more Ethereum.
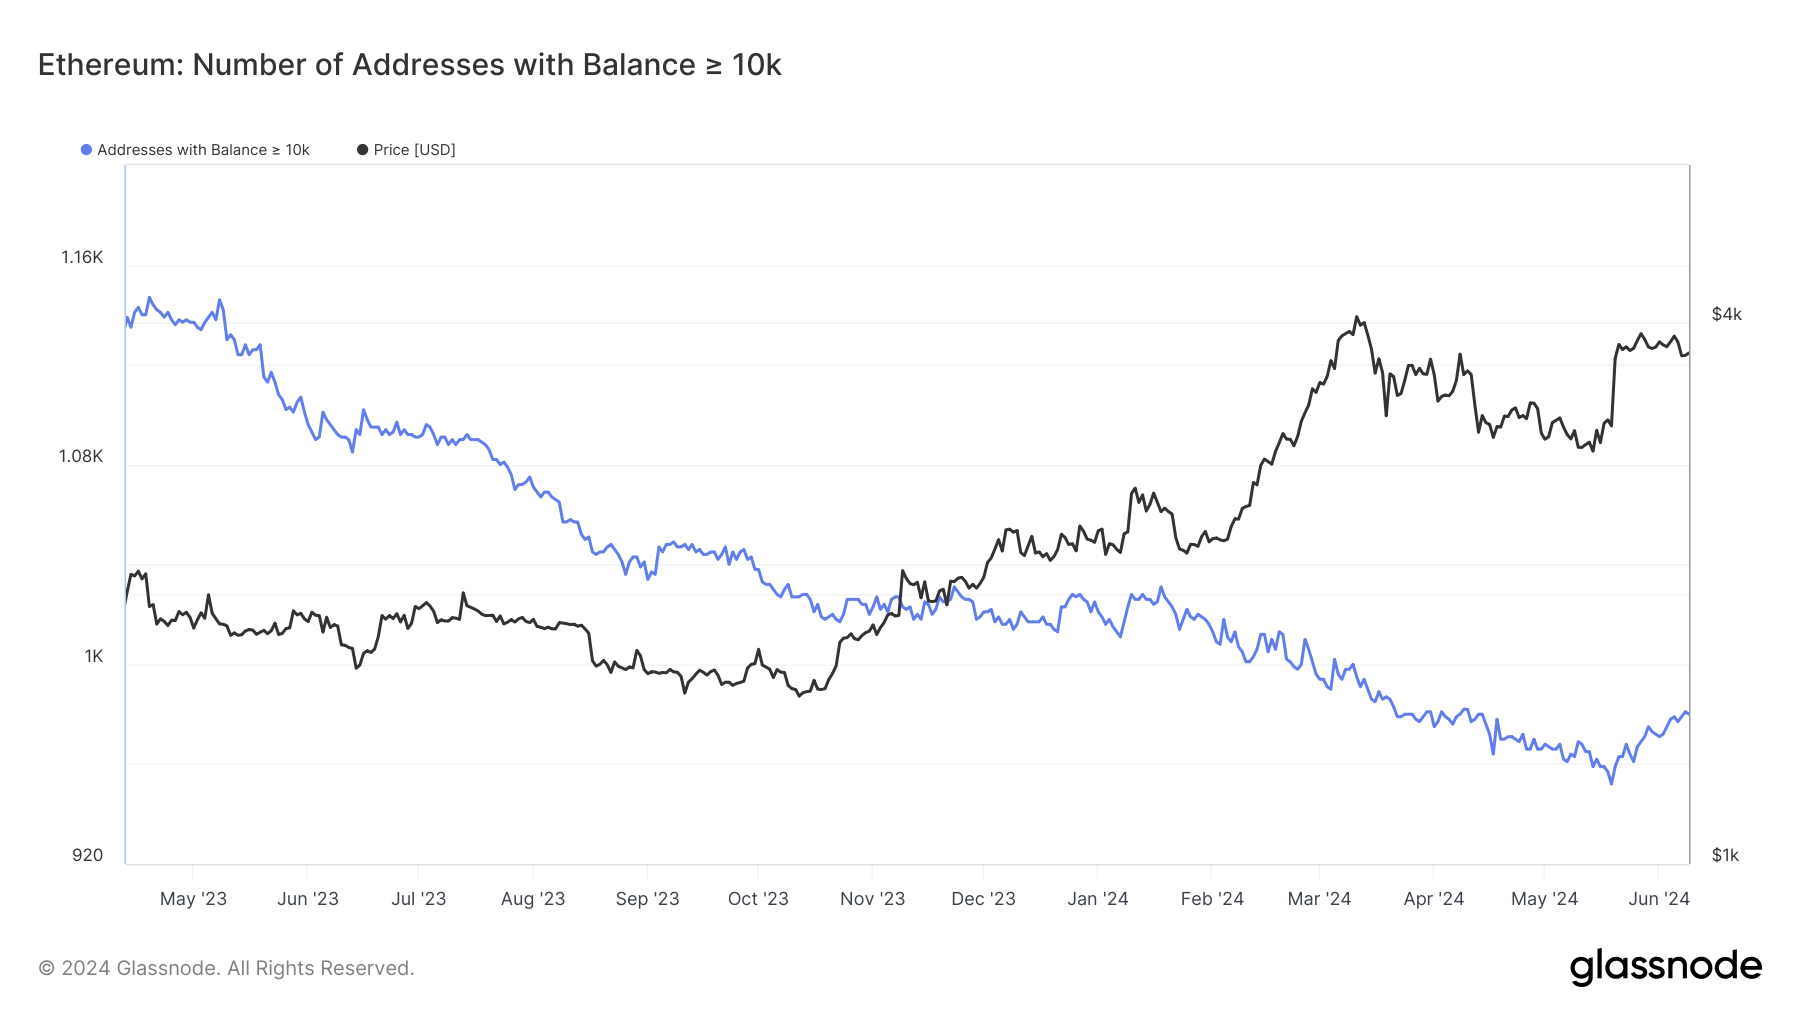
Source: Glassnode
Additionally, AMBCrypto’s look at the mega whale chart over the last 30 days revealed a noticeable development: the trend has flipped to the upside.
This indicated an increase in accumulation by most of the major wallets, reflecting heightened buying pressure.
With this move, it is just a matter of time before the price picks up—a trend that these addresses are betting on.
More Ethereum flows out of exchanges
Ethereum’s Netflow on CryptoQuant showed that it had been dominated by negative flows in the last few weeks. The chart indicated that the volume of outflows has consistently surpassed inflows in the new month.
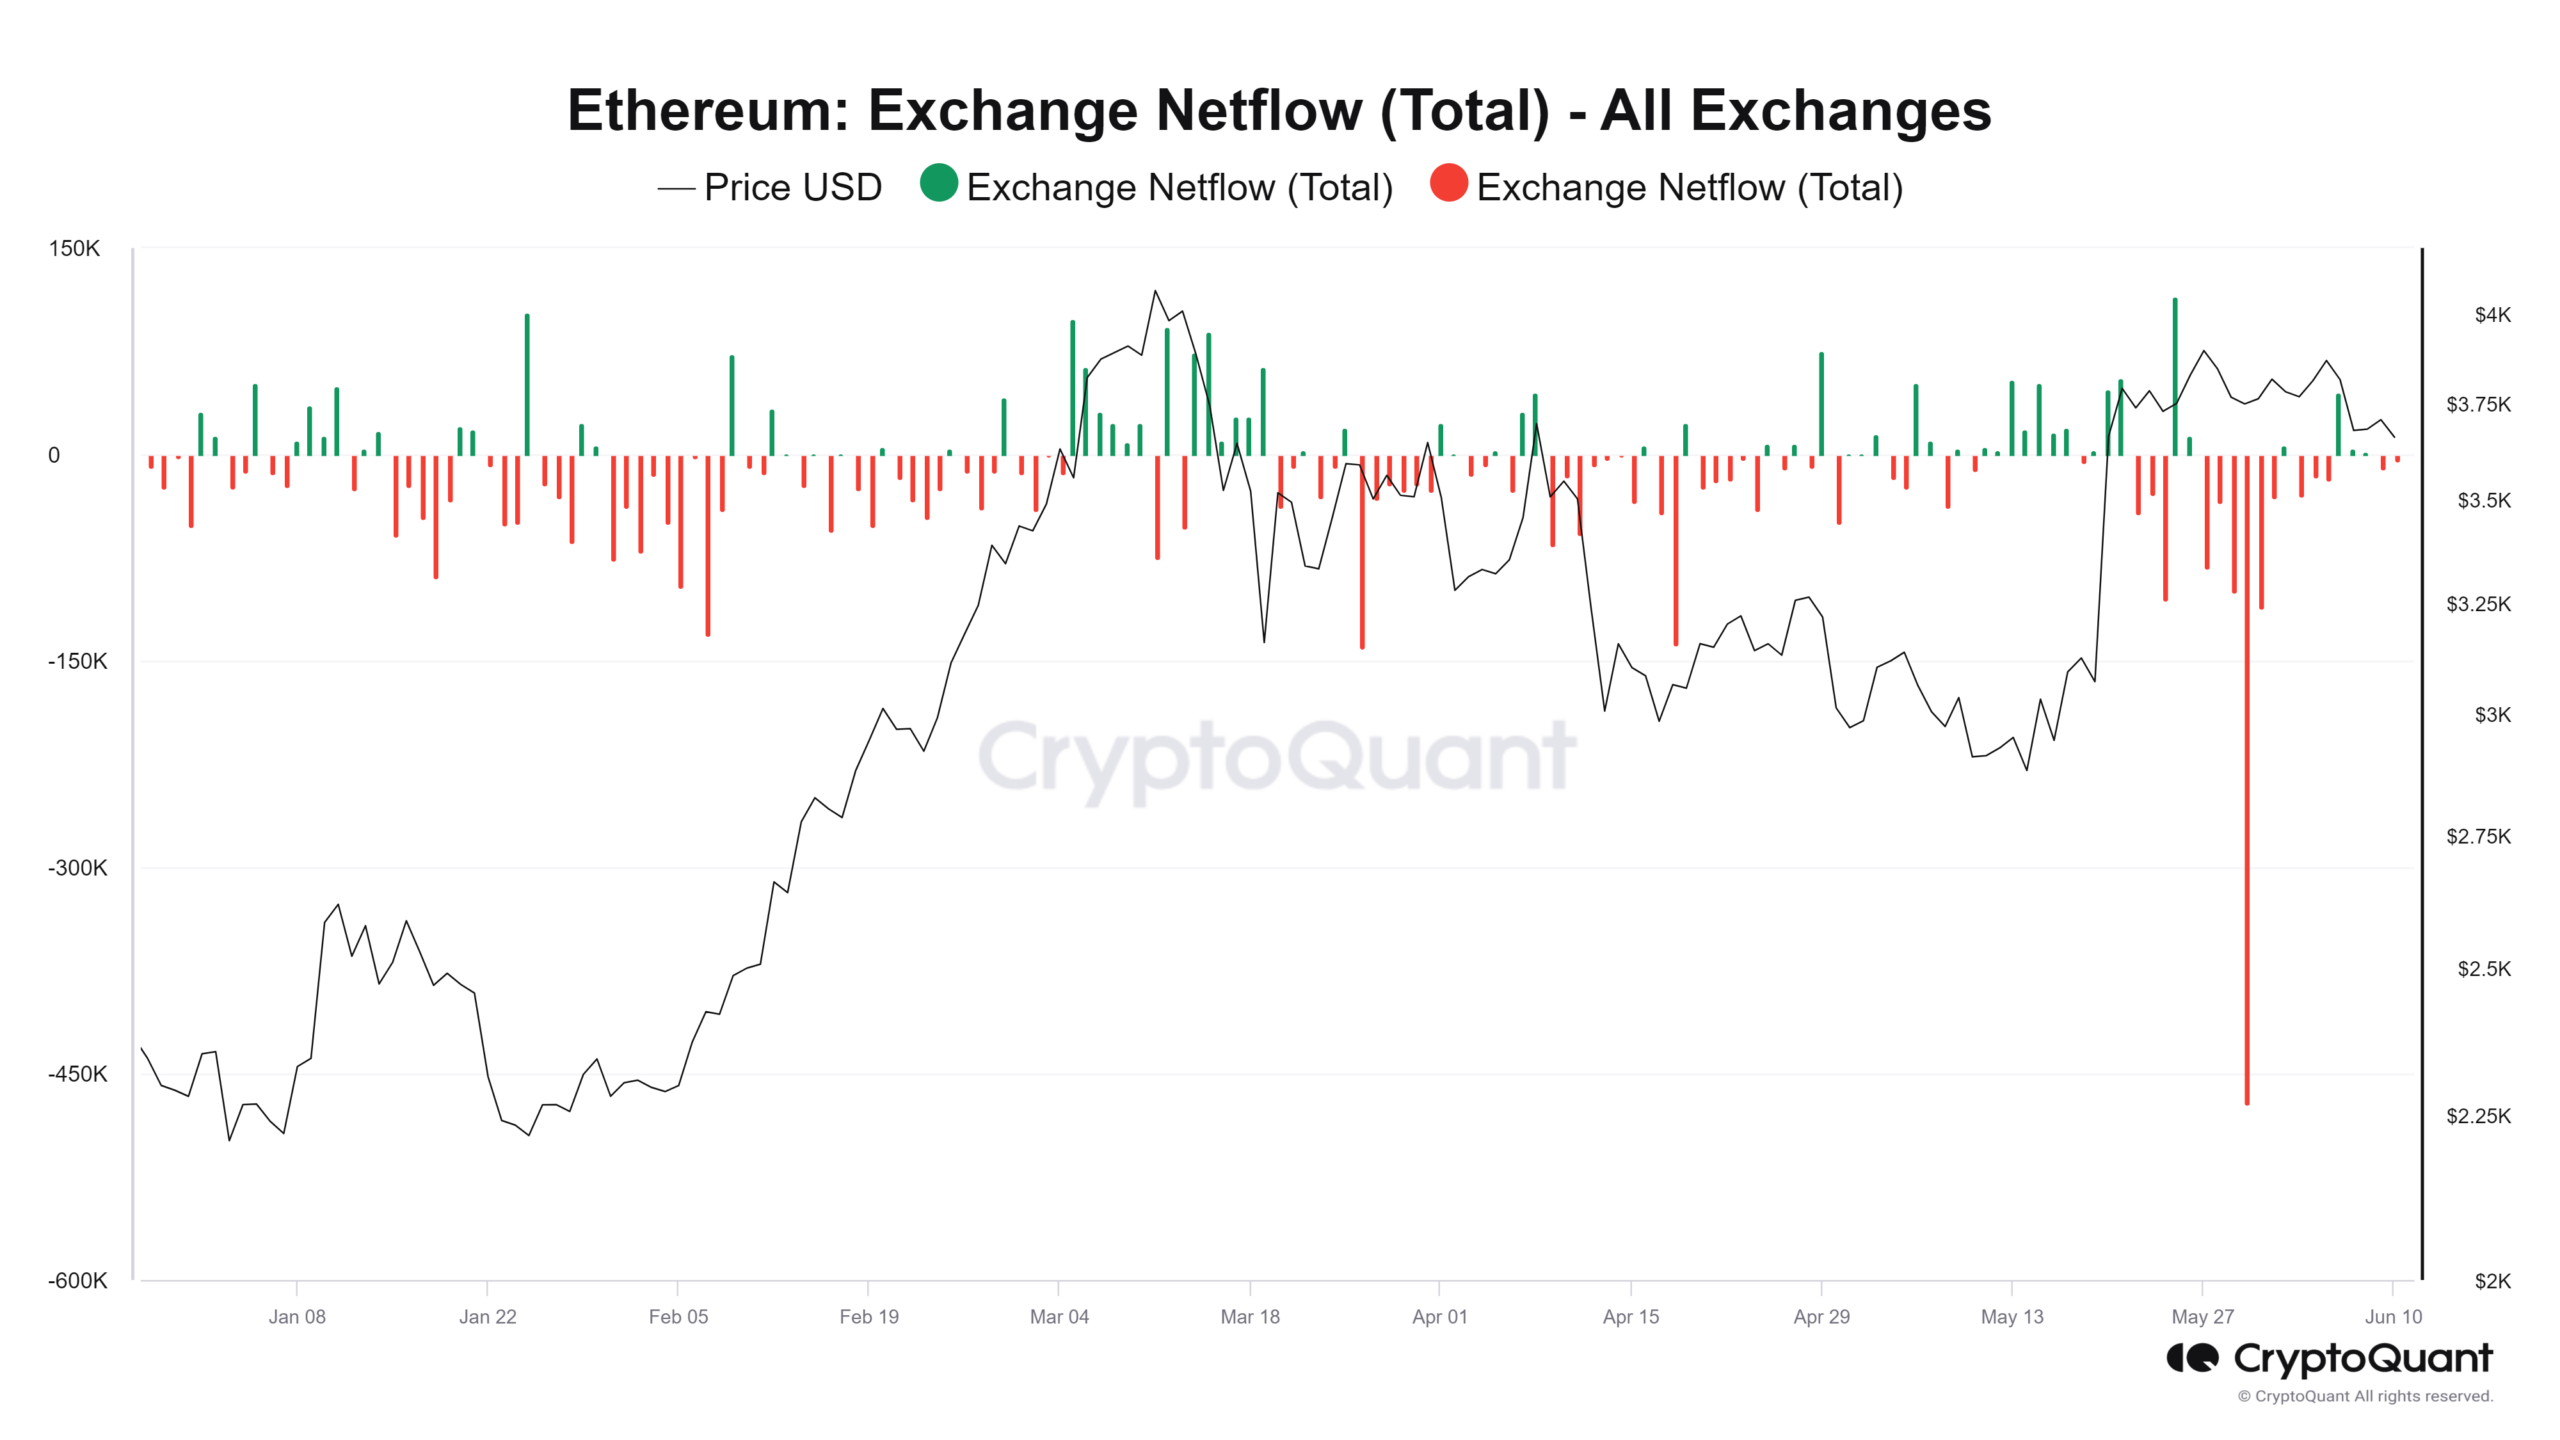
Source: CryptoQuant
A look at the chart showed that since the beginning of the new month, more ETH has left exchanges than has flowed into them.
The analysis indicated that from the 1st of June to now, the negative flow volume was over $354 million, while the positive netflow volume was around $226 million.
This netflow trend, combined with the accumulation by major wallets, is a positive sign for ETH despite its recent price trend.
ETH moves closer to the neutral line
AMBCrypto’s analysis of Ethereum on a daily timeframe showed that it has been trending in the $3,600 price range for the past three days.
As of this writing, it is trading at around $3,670, experiencing a decline of approximately 0.8%. ETH saw a slight gain in the previous trading session, but the recent decline has wiped this out.
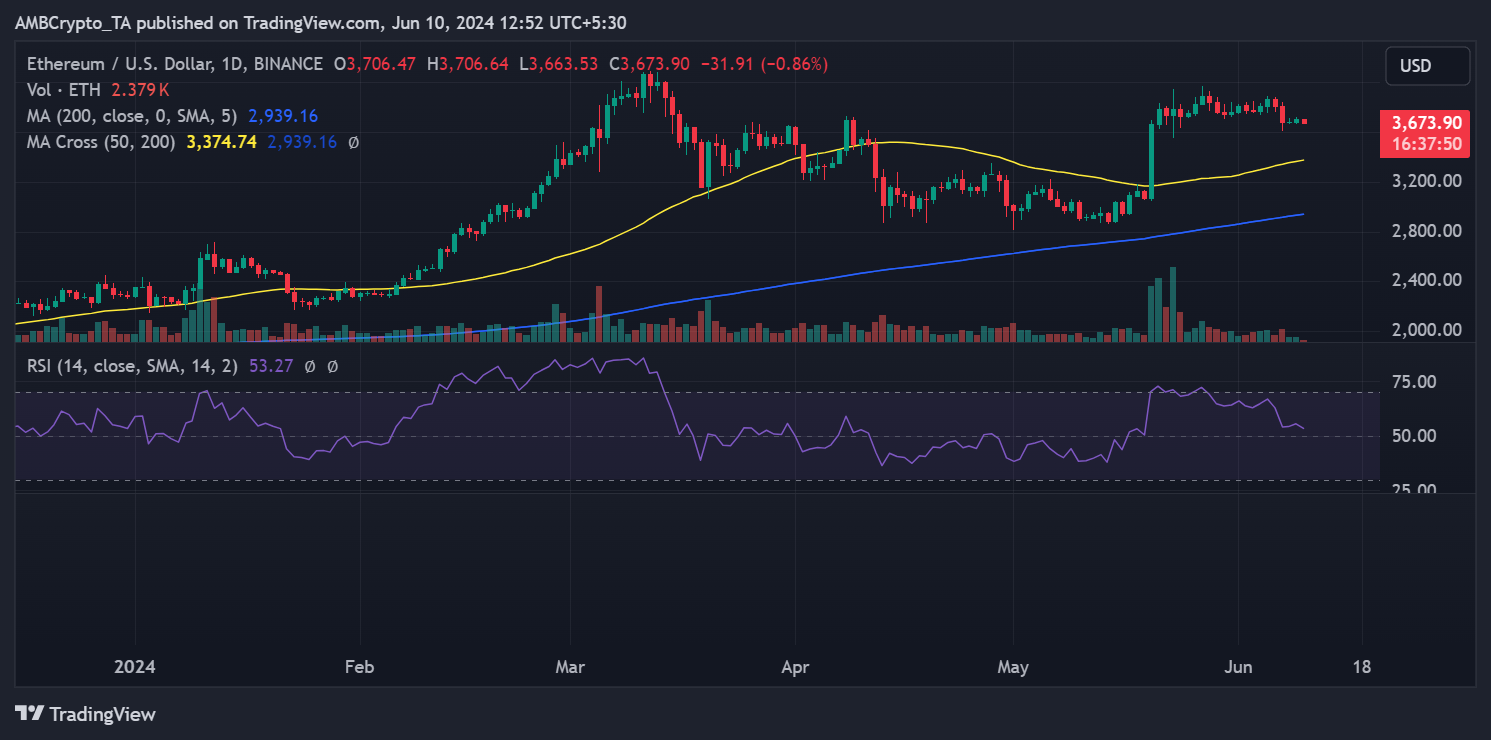
Source: TradingView
Realistic or not, here’s ETH’s market cap in BTC’s terms
Ethereum’s Relative Strength Index (RSI) showed that it was above 52 as of this writing. However, the RSI is on a downward trend, indicating that a further price decline could push it below the neutral line.
This means that while the trend is currently bullish, it is weakening.