
- Ethereum’s exchange data showed that ETH’s selling pressure was easing.
- However, ETH failed to recover amid a decline in demand.
Ethereum [ETH] has underperformed against Bitcoin [BTC] this year. The main reason behind this dismal performance is declining demand amid an increase in selling activity.
However, selling pressure might be on the verge of exhaustion. According to a Quicktake post by CryptoQuant, ETH netflow on derivative exchanges surpassed 40,000 ETH on the 7th of September.
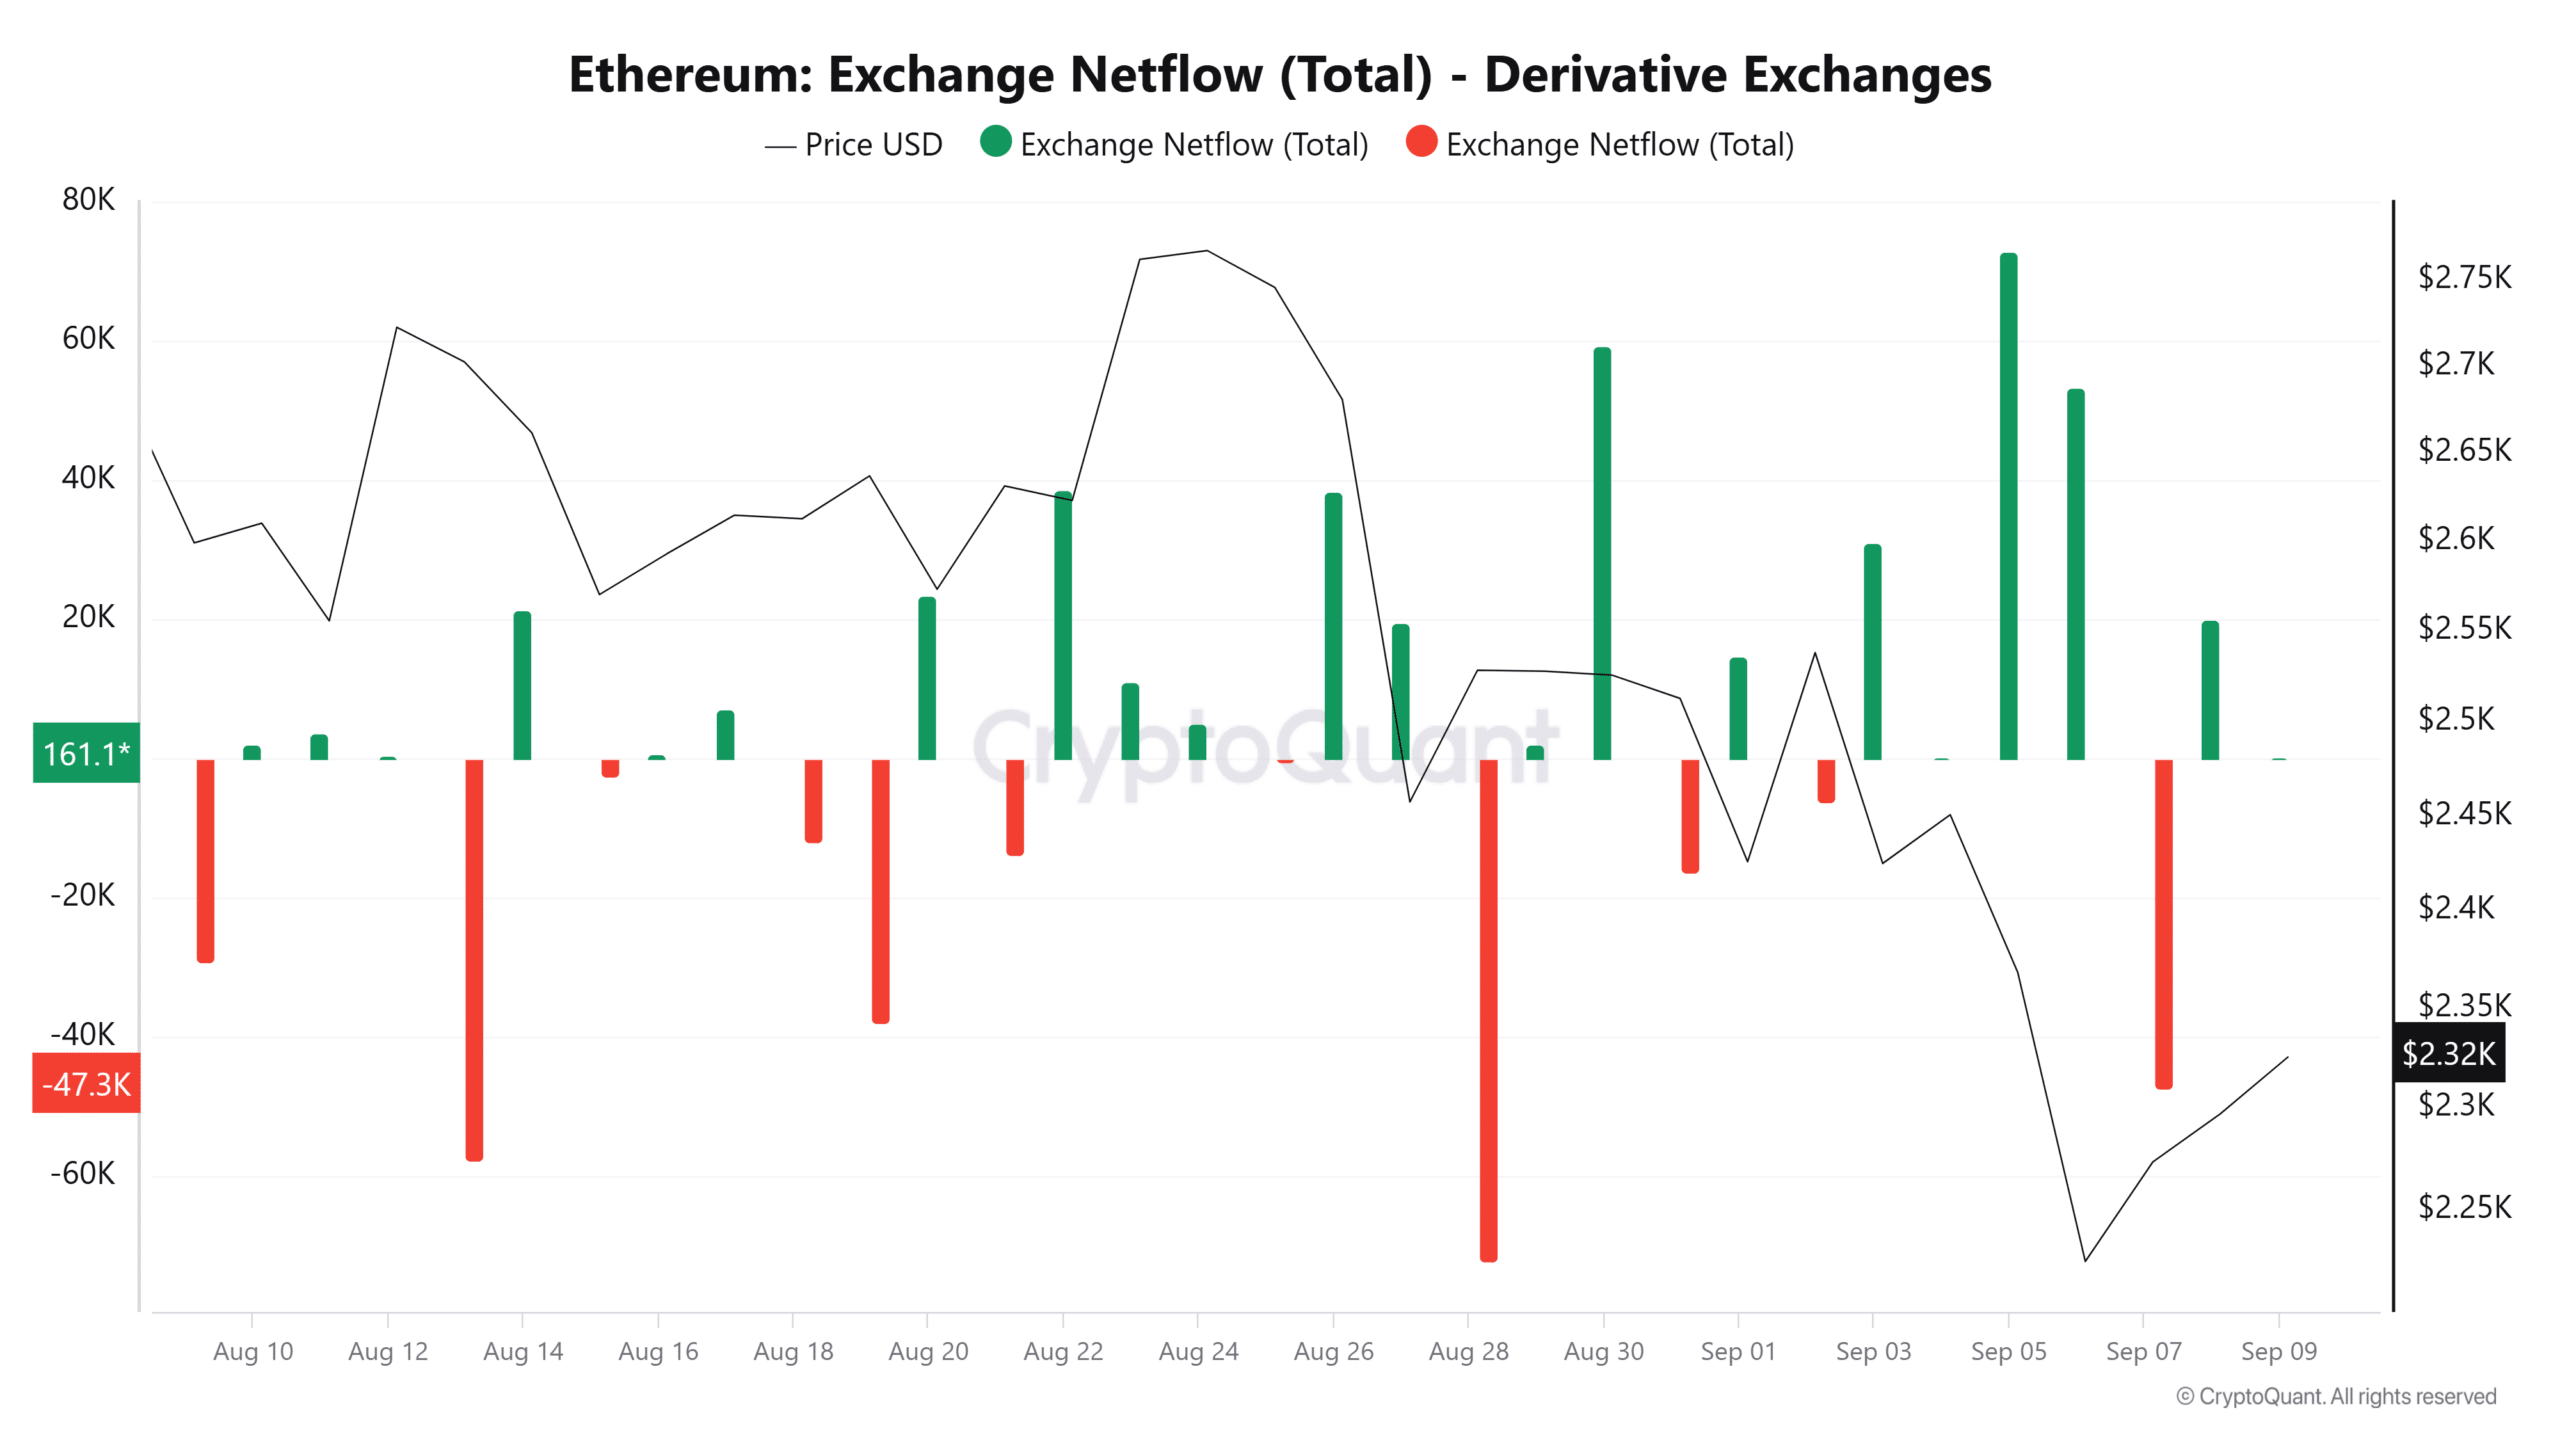
Source: CryptoQuant
An increase in the ETH being withdrawn from derivative exchanges suggested that selling pressure was dropping, and that traders were less interested in borrowing to open short selling positions.
Spot market selling spree continues
While data from the derivatives market showed that Ethereum traders were becoming less pessimistic, the same has not been seen in the spot market.
The Ethereum Foundation has continued to sell ETH and recently traded 450 ETH for $1M worth of DAI per SpotOnChain. In the last four days alone, the organization has sold $1.28M ETH tokens.
Metalpha, a Hong Kong-based crypto wealth manager, has also deposited more than $54M worth of ETH to Binance in the last three days, according to Lookonchain.
Despite the selling activity, the amount of ETH being deposited on spot exchanges is reducing. On the 8th of September, ETH’s exchange inflows reached 37,415 ETH, the lowest level since late July.
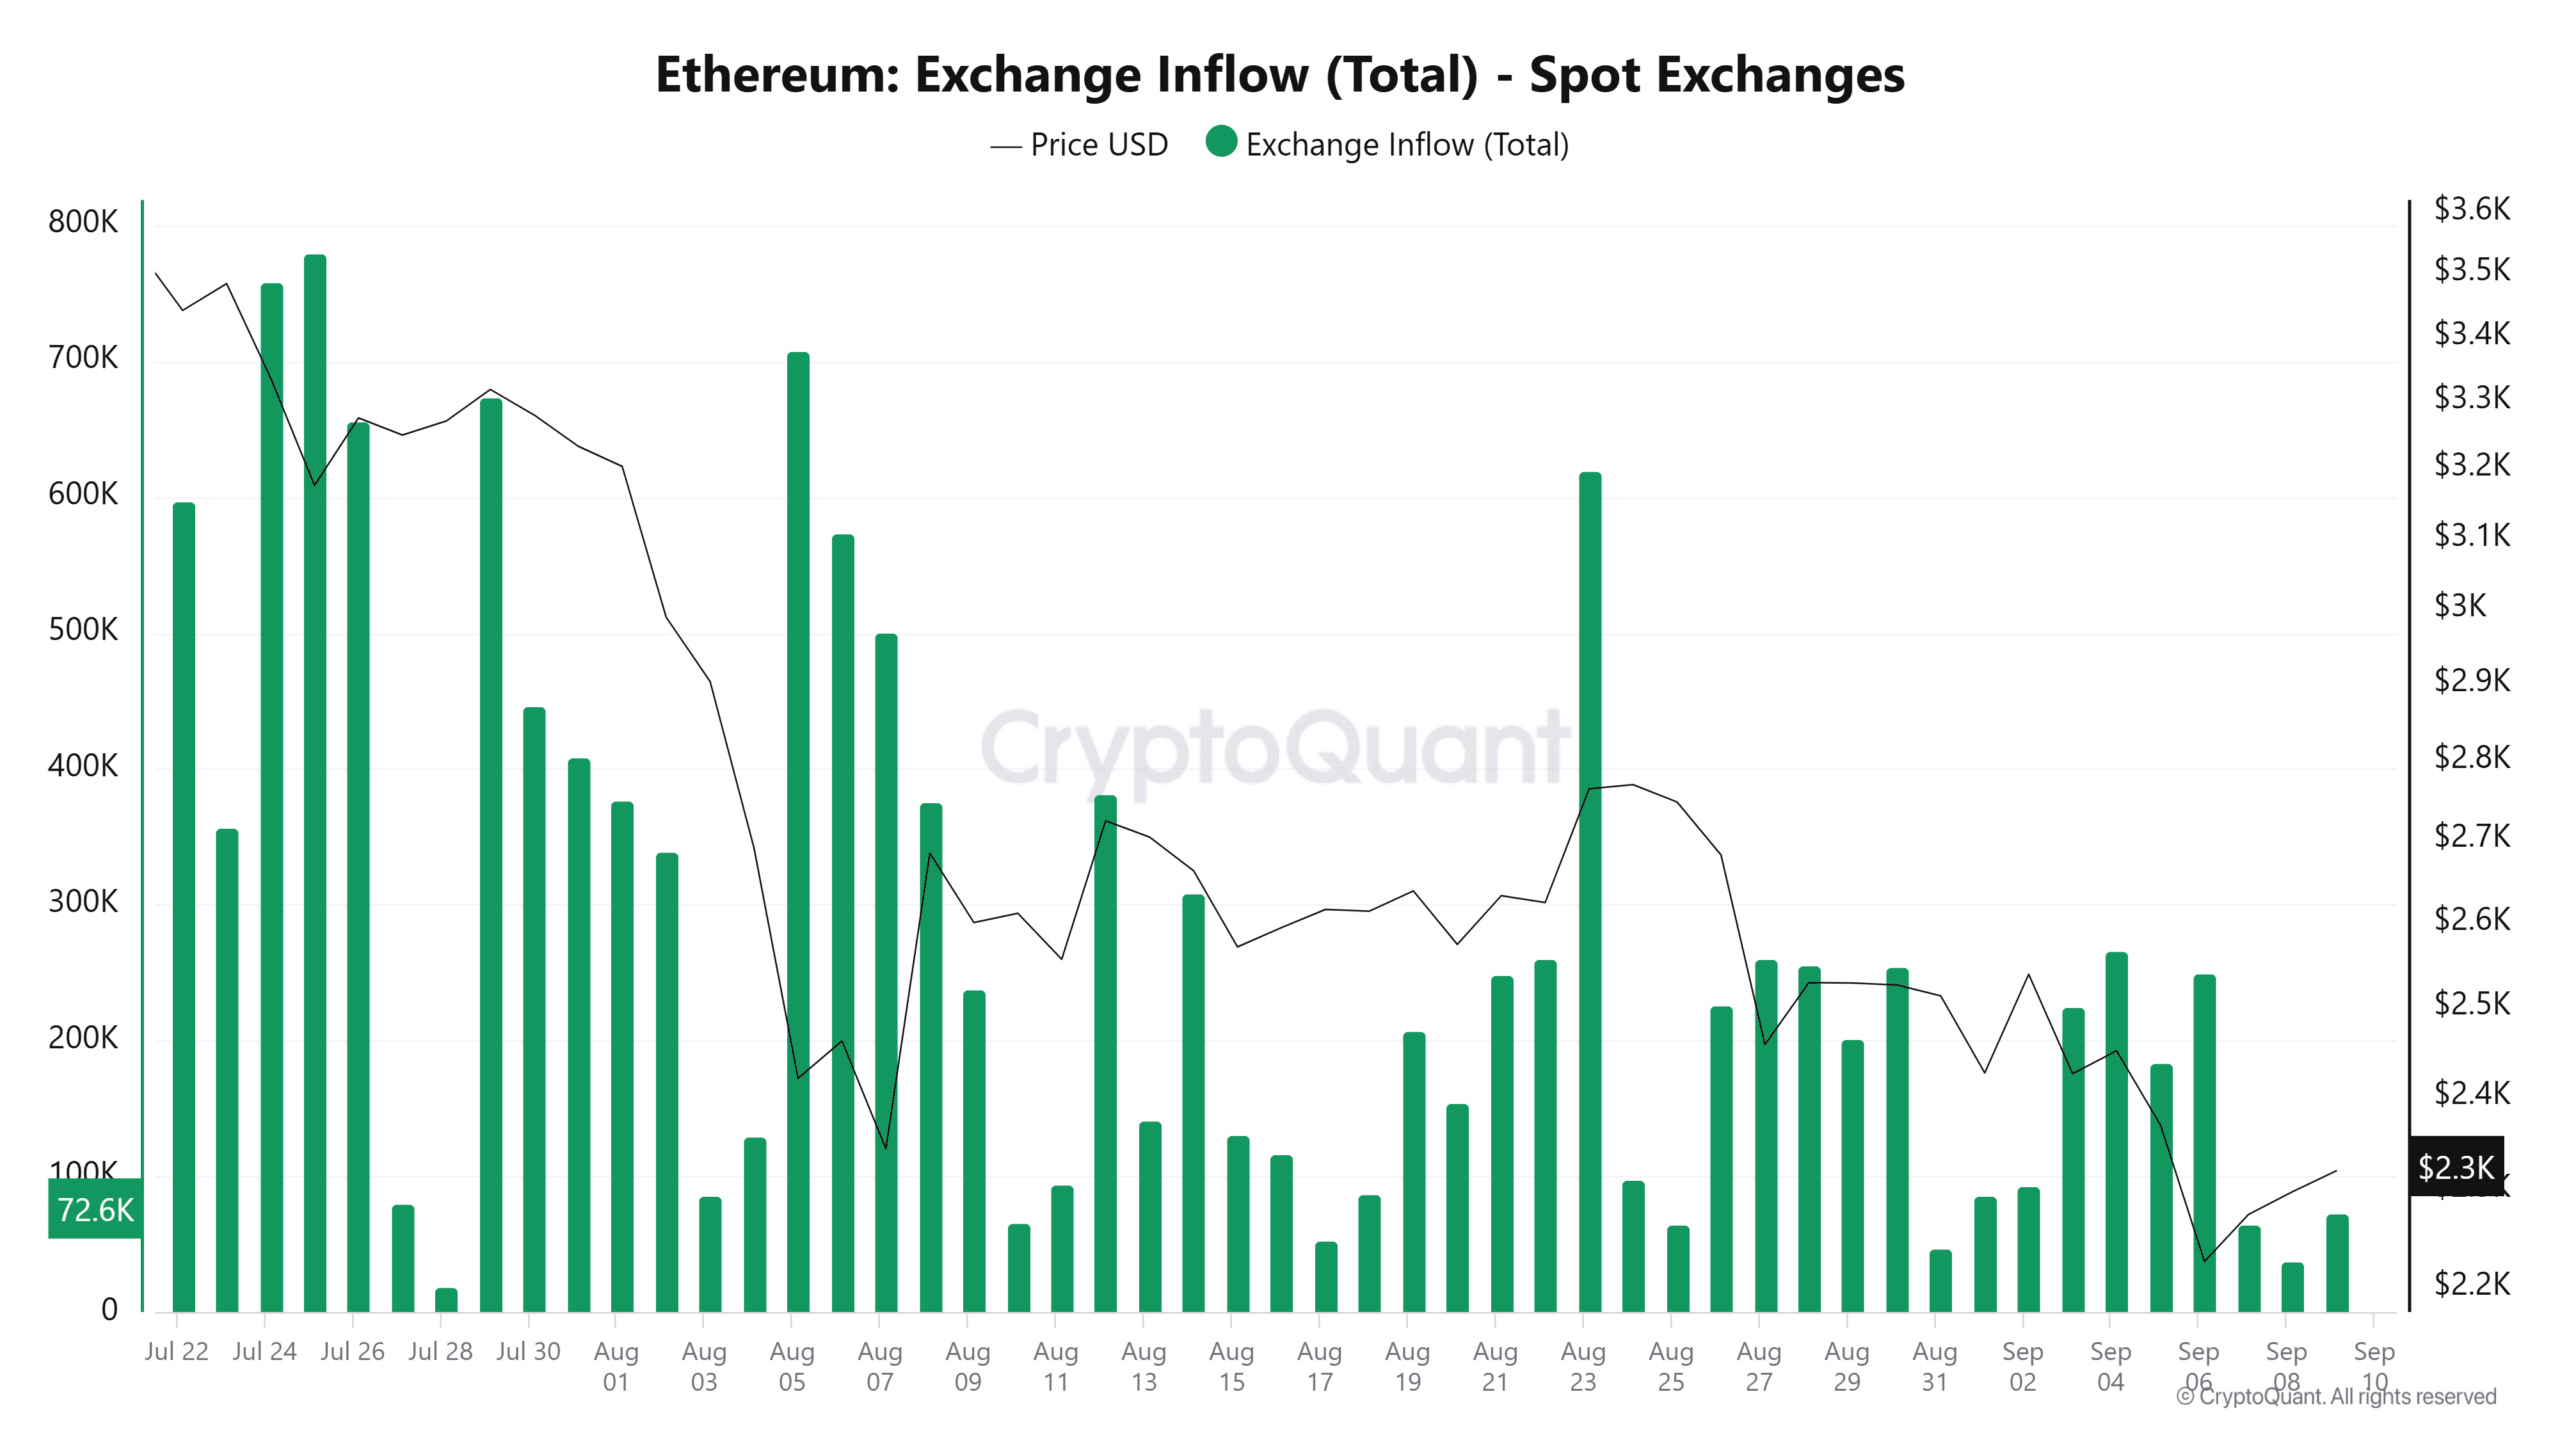
Source: CryptoQuant
Thus, while sellers remain active, selling momentum may be weakening.
Ethereum price action
ETH was trading at $2,319 at the time of writing after a slight 0.6% gain in 24 hours.
The altcoin was trading within a descending channel on the one-day chart, while the Awesome Oscillator was negative, showing that bears remained in control.
However, ETH is attempting a breakout to the upside after forming three green consecutive candles. If a breakout happens, it could signal a shift in momentum and the beginning of a rally.
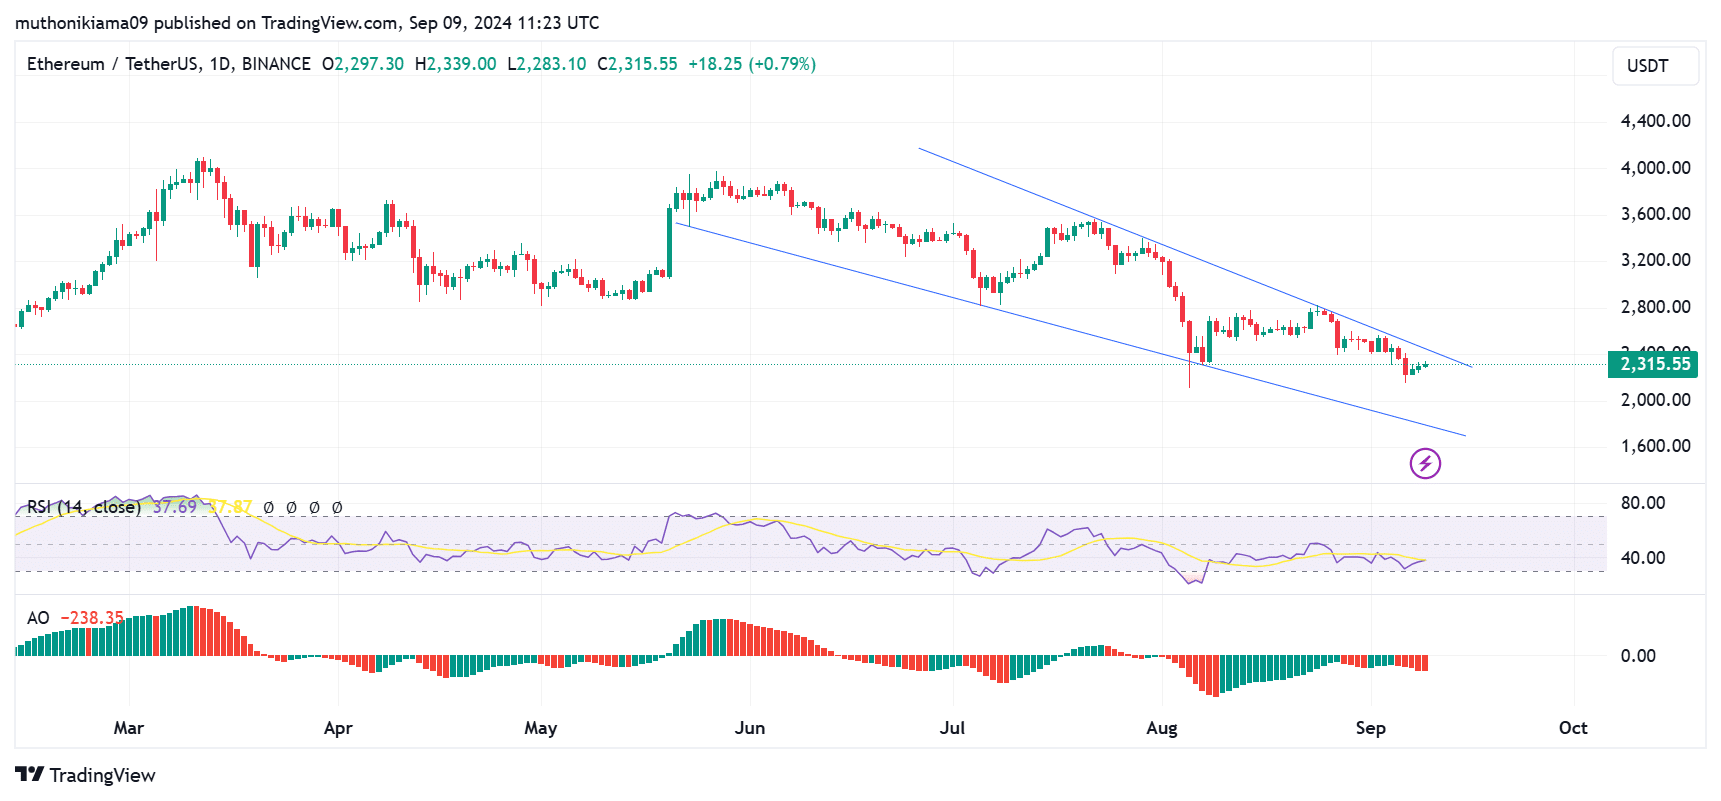
Source: TradingView
However, for this breakout to happen, buyers need to overwhelm sellers. At press time, the Relative Strength Index (RSI) was at 37, which pointed towards ETH being in bearish territory.
Read Ethereum’s [ETH] Price Prediction 2024–2025
The exhaustion of sellers has been seen in the movement of the RSI line as it attempts to crossover above the signal line. If this crossover is confirmed, it will show a buy signal.
Ethereum’s Funding Rates have also flipped positive, signaling optimism among futures traders despite the bearish sentiment.
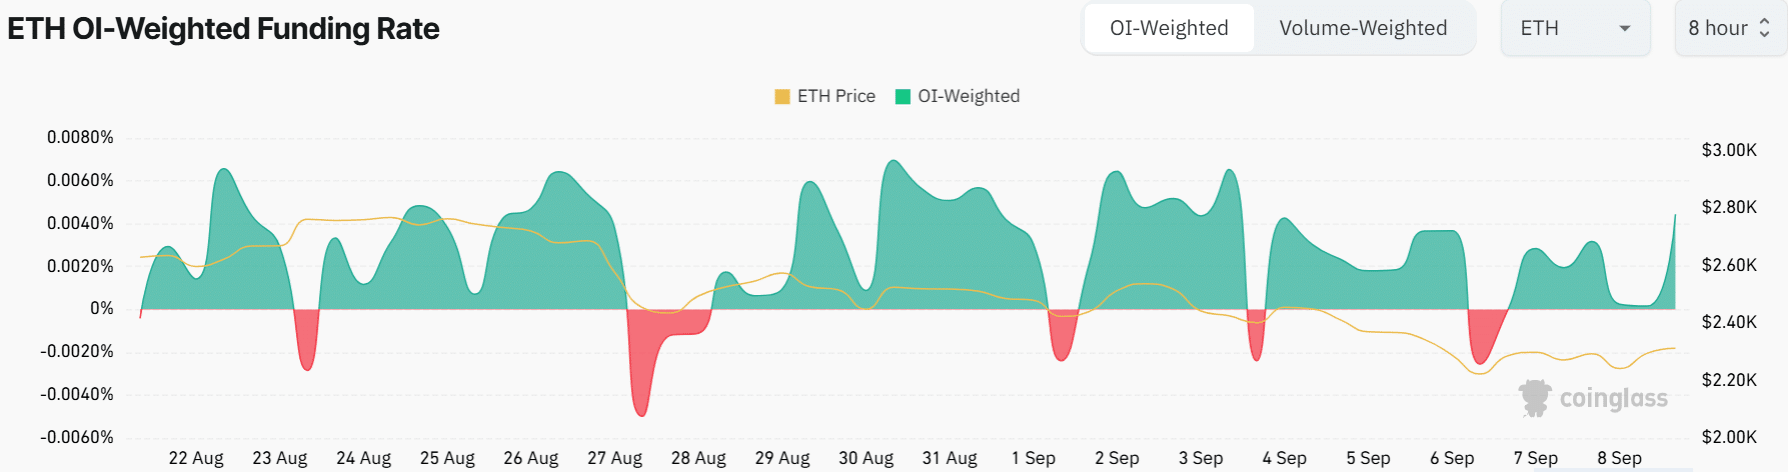
Source: Coinglass


![Chainlink [LINK] price prediction - Watch out for a defense of THIS key level!](https://ambcrypto.com/wp-content/uploads/2025/04/Evans-17-min-400x240.png)